Scandinavian vs White/Caucasian Doctorate Degree
COMPARE
Scandinavian
White/Caucasian
Doctorate Degree
Doctorate Degree Comparison
Scandinavians
Whites/Caucasians
1.8%
DOCTORATE DEGREE
48.0/ 100
METRIC RATING
180th/ 347
METRIC RANK
1.8%
DOCTORATE DEGREE
22.8/ 100
METRIC RATING
200th/ 347
METRIC RANK
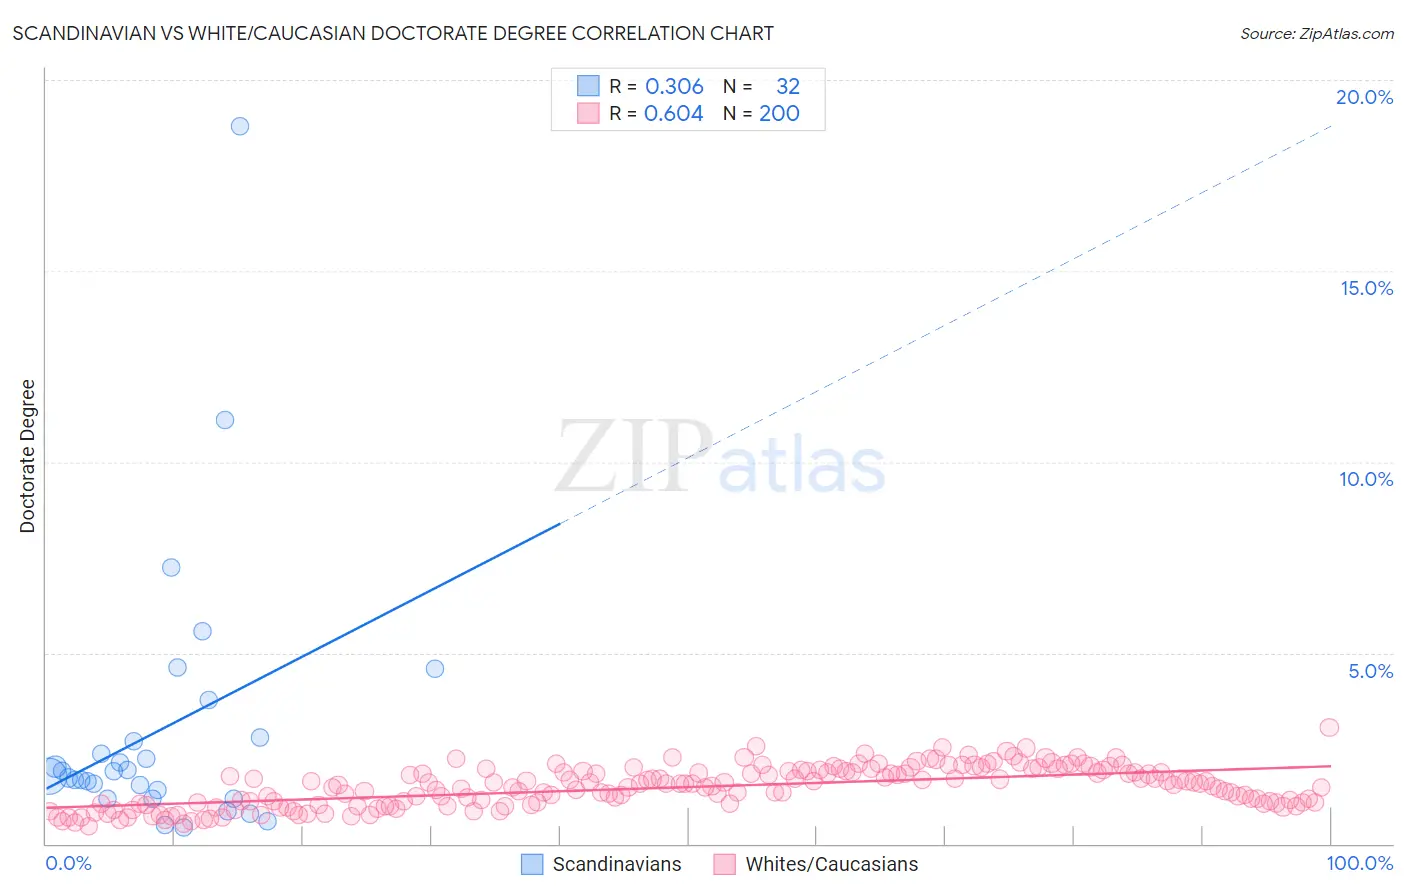
Scandinavian vs White/Caucasian Doctorate Degree Correlation Chart
The statistical analysis conducted on geographies consisting of 462,476,987 people shows a mild positive correlation between the proportion of Scandinavians and percentage of population with at least doctorate degree education in the United States with a correlation coefficient (R) of 0.306 and weighted average of 1.8%. Similarly, the statistical analysis conducted on geographies consisting of 553,713,140 people shows a significant positive correlation between the proportion of Whites/Caucasians and percentage of population with at least doctorate degree education in the United States with a correlation coefficient (R) of 0.604 and weighted average of 1.8%, a difference of 4.4%.
Doctorate Degree Correlation Summary
| Measurement | Scandinavian | White/Caucasian |
| Minimum | 0.41% | 0.45% |
| Maximum | 18.8% | 3.0% |
| Range | 18.4% | 2.6% |
| Mean | 3.0% | 1.5% |
| Median | 1.8% | 1.5% |
| Interquartile 25% (IQ1) | 1.3% | 1.0% |
| Interquartile 75% (IQ3) | 2.7% | 1.9% |
| Interquartile Range (IQR) | 1.4% | 0.85% |
| Standard Deviation (Sample) | 3.6% | 0.52% |
| Standard Deviation (Population) | 3.6% | 0.52% |
Demographics Similar to Scandinavians and Whites/Caucasians by Doctorate Degree
In terms of doctorate degree, the demographic groups most similar to Scandinavians are Immigrants (1.8%, a difference of 0.26%), Immigrants from Afghanistan (1.8%, a difference of 0.55%), Finnish (1.8%, a difference of 0.89%), Nigerian (1.8%, a difference of 1.2%), and Slovak (1.8%, a difference of 1.8%). Similarly, the demographic groups most similar to Whites/Caucasians are Immigrants from South America (1.8%, a difference of 0.11%), Immigrants from Ghana (1.8%, a difference of 0.40%), Chinese (1.8%, a difference of 0.48%), Subsaharan African (1.8%, a difference of 0.49%), and Immigrants from Somalia (1.8%, a difference of 0.56%).
| Demographics | Rating | Rank | Doctorate Degree |
| Scandinavians | 48.0 /100 | #180 | Average 1.8% |
| Immigrants | Immigrants | 46.2 /100 | #181 | Average 1.8% |
| Immigrants | Afghanistan | 44.3 /100 | #182 | Average 1.8% |
| Finns | 42.1 /100 | #183 | Average 1.8% |
| Nigerians | 39.9 /100 | #184 | Fair 1.8% |
| Slovaks | 36.4 /100 | #185 | Fair 1.8% |
| Peruvians | 34.4 /100 | #186 | Fair 1.8% |
| Czechoslovakians | 33.0 /100 | #187 | Fair 1.8% |
| Germans | 30.5 /100 | #188 | Fair 1.8% |
| French Canadians | 30.2 /100 | #189 | Fair 1.8% |
| Immigrants | Costa Rica | 30.2 /100 | #190 | Fair 1.8% |
| South Americans | 29.5 /100 | #191 | Fair 1.8% |
| Dutch | 27.4 /100 | #192 | Fair 1.8% |
| German Russians | 27.1 /100 | #193 | Fair 1.8% |
| Uruguayans | 26.2 /100 | #194 | Fair 1.8% |
| Immigrants | Somalia | 25.4 /100 | #195 | Fair 1.8% |
| Sub-Saharan Africans | 25.1 /100 | #196 | Fair 1.8% |
| Chinese | 25.1 /100 | #197 | Fair 1.8% |
| Immigrants | Ghana | 24.6 /100 | #198 | Fair 1.8% |
| Immigrants | South America | 23.3 /100 | #199 | Fair 1.8% |
| Whites/Caucasians | 22.8 /100 | #200 | Fair 1.8% |