Scandinavian vs Serbian Doctorate Degree
COMPARE
Scandinavian
Serbian
Doctorate Degree
Doctorate Degree Comparison
Scandinavians
Serbians
1.8%
DOCTORATE DEGREE
48.0/ 100
METRIC RATING
180th/ 347
METRIC RANK
2.0%
DOCTORATE DEGREE
88.7/ 100
METRIC RATING
135th/ 347
METRIC RANK
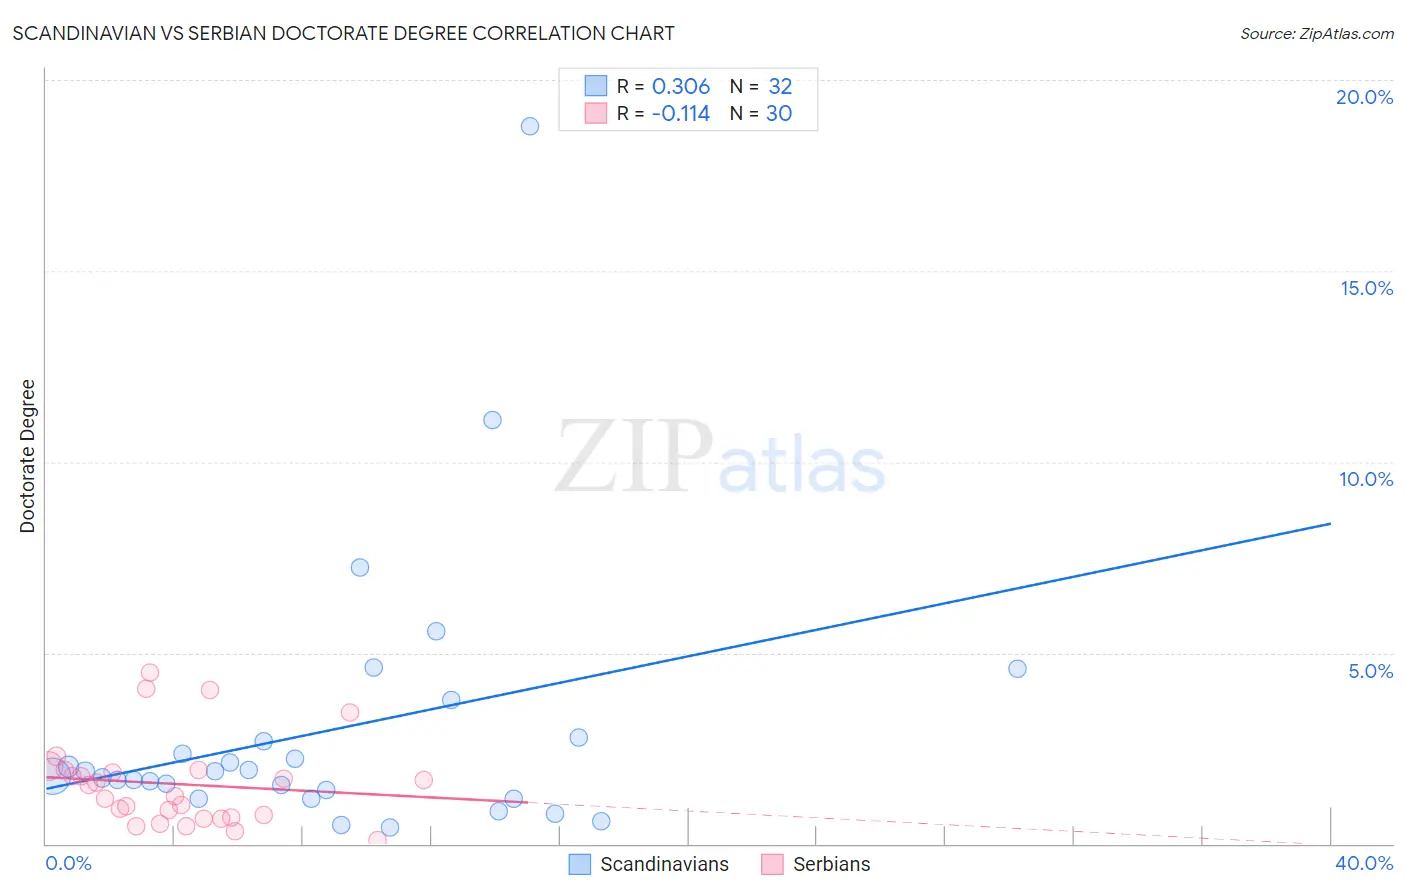
Scandinavian vs Serbian Doctorate Degree Correlation Chart
The statistical analysis conducted on geographies consisting of 462,476,987 people shows a mild positive correlation between the proportion of Scandinavians and percentage of population with at least doctorate degree education in the United States with a correlation coefficient (R) of 0.306 and weighted average of 1.8%. Similarly, the statistical analysis conducted on geographies consisting of 265,941,382 people shows a poor negative correlation between the proportion of Serbians and percentage of population with at least doctorate degree education in the United States with a correlation coefficient (R) of -0.114 and weighted average of 2.0%, a difference of 7.9%.
Doctorate Degree Correlation Summary
| Measurement | Scandinavian | Serbian |
| Minimum | 0.41% | 0.11% |
| Maximum | 18.8% | 4.5% |
| Range | 18.4% | 4.4% |
| Mean | 3.0% | 1.6% |
| Median | 1.8% | 1.4% |
| Interquartile 25% (IQ1) | 1.3% | 0.69% |
| Interquartile 75% (IQ3) | 2.7% | 1.9% |
| Interquartile Range (IQR) | 1.4% | 1.2% |
| Standard Deviation (Sample) | 3.6% | 1.1% |
| Standard Deviation (Population) | 3.6% | 1.1% |
Similar Demographics by Doctorate Degree
Demographics Similar to Scandinavians by Doctorate Degree
In terms of doctorate degree, the demographic groups most similar to Scandinavians are Ghanaian (1.8%, a difference of 0.050%), French (1.8%, a difference of 0.12%), Iraqi (1.8%, a difference of 0.18%), Spanish (1.8%, a difference of 0.19%), and Immigrants from Thailand (1.8%, a difference of 0.21%).
| Demographics | Rating | Rank | Doctorate Degree |
| Norwegians | 50.0 /100 | #173 | Average 1.8% |
| Immigrants | Bangladesh | 50.0 /100 | #174 | Average 1.8% |
| Immigrants | Thailand | 49.4 /100 | #175 | Average 1.8% |
| Spanish | 49.3 /100 | #176 | Average 1.8% |
| Iraqis | 49.2 /100 | #177 | Average 1.8% |
| French | 48.8 /100 | #178 | Average 1.8% |
| Ghanaians | 48.3 /100 | #179 | Average 1.8% |
| Scandinavians | 48.0 /100 | #180 | Average 1.8% |
| Immigrants | Immigrants | 46.2 /100 | #181 | Average 1.8% |
| Immigrants | Afghanistan | 44.3 /100 | #182 | Average 1.8% |
| Finns | 42.1 /100 | #183 | Average 1.8% |
| Nigerians | 39.9 /100 | #184 | Fair 1.8% |
| Slovaks | 36.4 /100 | #185 | Fair 1.8% |
| Peruvians | 34.4 /100 | #186 | Fair 1.8% |
| Czechoslovakians | 33.0 /100 | #187 | Fair 1.8% |
Demographics Similar to Serbians by Doctorate Degree
In terms of doctorate degree, the demographic groups most similar to Serbians are Immigrants from Cameroon (2.0%, a difference of 0.060%), Swedish (2.0%, a difference of 0.14%), South American Indian (2.0%, a difference of 0.15%), Immigrants from Uzbekistan (2.0%, a difference of 0.21%), and Swiss (2.0%, a difference of 0.24%).
| Demographics | Rating | Rank | Doctorate Degree |
| Immigrants | Zaire | 91.1 /100 | #128 | Exceptional 2.0% |
| Canadians | 90.6 /100 | #129 | Exceptional 2.0% |
| Immigrants | Ukraine | 90.5 /100 | #130 | Exceptional 2.0% |
| Immigrants | Sierra Leone | 90.2 /100 | #131 | Exceptional 2.0% |
| Scottish | 89.4 /100 | #132 | Excellent 2.0% |
| Immigrants | Uzbekistan | 89.3 /100 | #133 | Excellent 2.0% |
| Immigrants | Cameroon | 88.9 /100 | #134 | Excellent 2.0% |
| Serbians | 88.7 /100 | #135 | Excellent 2.0% |
| Swedes | 88.3 /100 | #136 | Excellent 2.0% |
| South American Indians | 88.3 /100 | #137 | Excellent 2.0% |
| Swiss | 88.0 /100 | #138 | Excellent 2.0% |
| Afghans | 87.2 /100 | #139 | Excellent 2.0% |
| Immigrants | Africa | 87.0 /100 | #140 | Excellent 2.0% |
| Senegalese | 86.7 /100 | #141 | Excellent 2.0% |
| Italians | 86.0 /100 | #142 | Excellent 2.0% |