Scandinavian vs Nonimmigrants Doctorate Degree
COMPARE
Scandinavian
Nonimmigrants
Doctorate Degree
Doctorate Degree Comparison
Scandinavians
Nonimmigrants
1.8%
DOCTORATE DEGREE
48.0/ 100
METRIC RATING
180th/ 347
METRIC RANK
1.7%
DOCTORATE DEGREE
8.8/ 100
METRIC RATING
221st/ 347
METRIC RANK
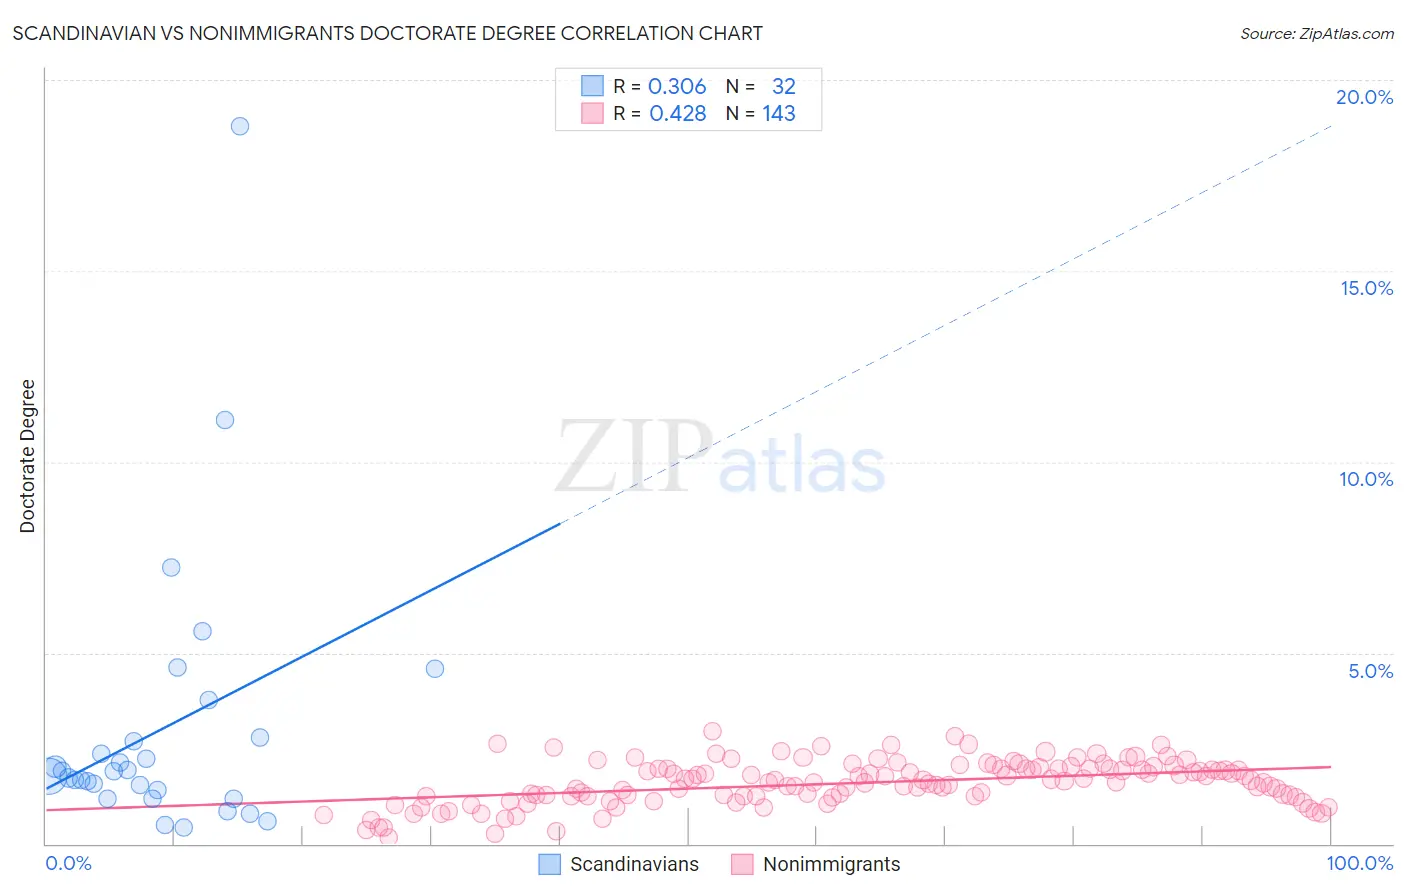
Scandinavian vs Nonimmigrants Doctorate Degree Correlation Chart
The statistical analysis conducted on geographies consisting of 462,476,987 people shows a mild positive correlation between the proportion of Scandinavians and percentage of population with at least doctorate degree education in the United States with a correlation coefficient (R) of 0.306 and weighted average of 1.8%. Similarly, the statistical analysis conducted on geographies consisting of 553,265,434 people shows a moderate positive correlation between the proportion of Nonimmigrants and percentage of population with at least doctorate degree education in the United States with a correlation coefficient (R) of 0.428 and weighted average of 1.7%, a difference of 9.0%.
Doctorate Degree Correlation Summary
| Measurement | Scandinavian | Nonimmigrants |
| Minimum | 0.41% | 0.18% |
| Maximum | 18.8% | 2.9% |
| Range | 18.4% | 2.8% |
| Mean | 3.0% | 1.6% |
| Median | 1.8% | 1.7% |
| Interquartile 25% (IQ1) | 1.3% | 1.2% |
| Interquartile 75% (IQ3) | 2.7% | 2.0% |
| Interquartile Range (IQR) | 1.4% | 0.73% |
| Standard Deviation (Sample) | 3.6% | 0.57% |
| Standard Deviation (Population) | 3.6% | 0.56% |
Similar Demographics by Doctorate Degree
Demographics Similar to Scandinavians by Doctorate Degree
In terms of doctorate degree, the demographic groups most similar to Scandinavians are Ghanaian (1.8%, a difference of 0.050%), French (1.8%, a difference of 0.12%), Iraqi (1.8%, a difference of 0.18%), Spanish (1.8%, a difference of 0.19%), and Immigrants from Thailand (1.8%, a difference of 0.21%).
| Demographics | Rating | Rank | Doctorate Degree |
| Norwegians | 50.0 /100 | #173 | Average 1.8% |
| Immigrants | Bangladesh | 50.0 /100 | #174 | Average 1.8% |
| Immigrants | Thailand | 49.4 /100 | #175 | Average 1.8% |
| Spanish | 49.3 /100 | #176 | Average 1.8% |
| Iraqis | 49.2 /100 | #177 | Average 1.8% |
| French | 48.8 /100 | #178 | Average 1.8% |
| Ghanaians | 48.3 /100 | #179 | Average 1.8% |
| Scandinavians | 48.0 /100 | #180 | Average 1.8% |
| Immigrants | Immigrants | 46.2 /100 | #181 | Average 1.8% |
| Immigrants | Afghanistan | 44.3 /100 | #182 | Average 1.8% |
| Finns | 42.1 /100 | #183 | Average 1.8% |
| Nigerians | 39.9 /100 | #184 | Fair 1.8% |
| Slovaks | 36.4 /100 | #185 | Fair 1.8% |
| Peruvians | 34.4 /100 | #186 | Fair 1.8% |
| Czechoslovakians | 33.0 /100 | #187 | Fair 1.8% |
Demographics Similar to Nonimmigrants by Doctorate Degree
In terms of doctorate degree, the demographic groups most similar to Nonimmigrants are Immigrants from Venezuela (1.7%, a difference of 0.070%), Immigrants from Uruguay (1.7%, a difference of 0.19%), Immigrants from Bosnia and Herzegovina (1.7%, a difference of 0.53%), Immigrants from Poland (1.7%, a difference of 0.75%), and Immigrants from Iraq (1.7%, a difference of 0.85%).
| Demographics | Rating | Rank | Doctorate Degree |
| Pueblo | 14.2 /100 | #214 | Poor 1.7% |
| Alaskan Athabascans | 13.8 /100 | #215 | Poor 1.7% |
| Immigrants | Burma/Myanmar | 13.5 /100 | #216 | Poor 1.7% |
| Spanish Americans | 12.9 /100 | #217 | Poor 1.7% |
| Tlingit-Haida | 11.9 /100 | #218 | Poor 1.7% |
| Immigrants | Iraq | 10.7 /100 | #219 | Poor 1.7% |
| Immigrants | Uruguay | 9.2 /100 | #220 | Tragic 1.7% |
| Immigrants | Nonimmigrants | 8.8 /100 | #221 | Tragic 1.7% |
| Immigrants | Venezuela | 8.7 /100 | #222 | Tragic 1.7% |
| Immigrants | Bosnia and Herzegovina | 7.8 /100 | #223 | Tragic 1.7% |
| Immigrants | Poland | 7.4 /100 | #224 | Tragic 1.7% |
| Immigrants | Colombia | 6.7 /100 | #225 | Tragic 1.7% |
| Osage | 6.5 /100 | #226 | Tragic 1.7% |
| Panamanians | 6.3 /100 | #227 | Tragic 1.7% |
| Assyrians/Chaldeans/Syriacs | 5.9 /100 | #228 | Tragic 1.7% |