Immigrants from Switzerland vs Immigrants from Burma/Myanmar 6th Grade
COMPARE
Immigrants from Switzerland
Immigrants from Burma/Myanmar
6th Grade
6th Grade Comparison
Immigrants from Switzerland
Immigrants from Burma/Myanmar
97.4%
6TH GRADE
95.7/ 100
METRIC RATING
115th/ 347
METRIC RANK
95.7%
6TH GRADE
0.0/ 100
METRIC RATING
302nd/ 347
METRIC RANK
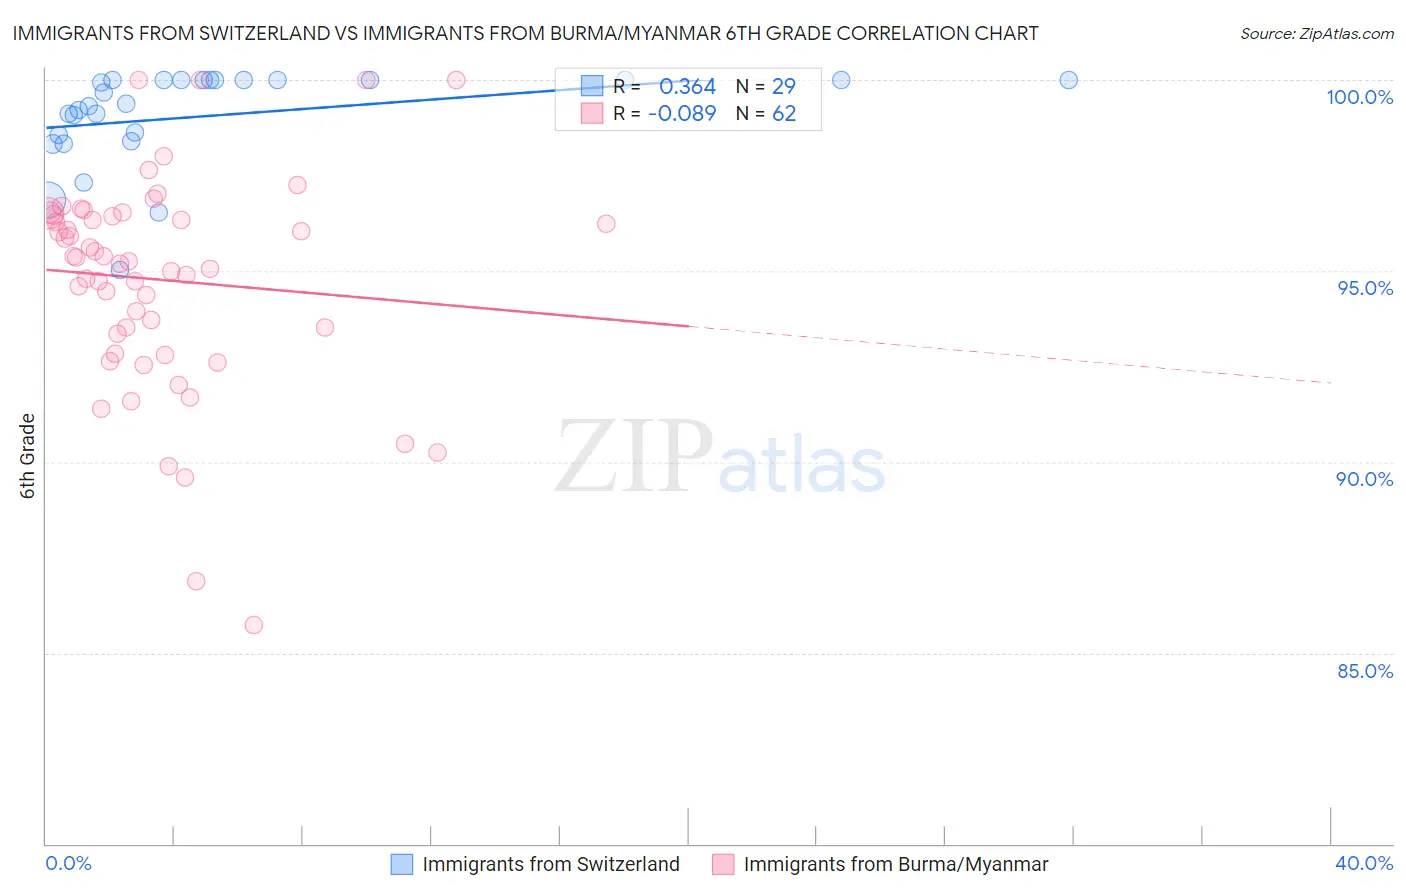
Immigrants from Switzerland vs Immigrants from Burma/Myanmar 6th Grade Correlation Chart
The statistical analysis conducted on geographies consisting of 148,082,451 people shows a mild positive correlation between the proportion of Immigrants from Switzerland and percentage of population with at least 6th grade education in the United States with a correlation coefficient (R) of 0.364 and weighted average of 97.4%. Similarly, the statistical analysis conducted on geographies consisting of 172,326,083 people shows a slight negative correlation between the proportion of Immigrants from Burma/Myanmar and percentage of population with at least 6th grade education in the United States with a correlation coefficient (R) of -0.089 and weighted average of 95.7%, a difference of 1.8%.
6th Grade Correlation Summary
| Measurement | Immigrants from Switzerland | Immigrants from Burma/Myanmar |
| Minimum | 95.0% | 85.7% |
| Maximum | 100.0% | 100.0% |
| Range | 5.0% | 14.3% |
| Mean | 99.1% | 94.8% |
| Median | 99.4% | 95.3% |
| Interquartile 25% (IQ1) | 98.5% | 93.4% |
| Interquartile 75% (IQ3) | 100.0% | 96.5% |
| Interquartile Range (IQR) | 1.5% | 3.1% |
| Standard Deviation (Sample) | 1.3% | 2.8% |
| Standard Deviation (Population) | 1.2% | 2.8% |
Similar Demographics by 6th Grade
Demographics Similar to Immigrants from Switzerland by 6th Grade
In terms of 6th grade, the demographic groups most similar to Immigrants from Switzerland are Lebanese (97.4%, a difference of 0.0%), Basque (97.4%, a difference of 0.010%), Immigrants from Japan (97.4%, a difference of 0.010%), Immigrants from Saudi Arabia (97.4%, a difference of 0.020%), and Colville (97.4%, a difference of 0.020%).
| Demographics | Rating | Rank | 6th Grade |
| Immigrants | Nonimmigrants | 97.3 /100 | #108 | Exceptional 97.4% |
| Immigrants | Czechoslovakia | 97.3 /100 | #109 | Exceptional 97.4% |
| Thais | 96.9 /100 | #110 | Exceptional 97.4% |
| Iroquois | 96.9 /100 | #111 | Exceptional 97.4% |
| Immigrants | Latvia | 96.7 /100 | #112 | Exceptional 97.4% |
| Immigrants | Saudi Arabia | 96.5 /100 | #113 | Exceptional 97.4% |
| Colville | 96.4 /100 | #114 | Exceptional 97.4% |
| Immigrants | Switzerland | 95.7 /100 | #115 | Exceptional 97.4% |
| Lebanese | 95.5 /100 | #116 | Exceptional 97.4% |
| Basques | 95.4 /100 | #117 | Exceptional 97.4% |
| Immigrants | Japan | 95.2 /100 | #118 | Exceptional 97.4% |
| Immigrants | Zimbabwe | 95.0 /100 | #119 | Exceptional 97.4% |
| Syrians | 94.8 /100 | #120 | Exceptional 97.4% |
| Immigrants | Norway | 94.7 /100 | #121 | Exceptional 97.4% |
| Immigrants | France | 94.5 /100 | #122 | Exceptional 97.4% |
Demographics Similar to Immigrants from Burma/Myanmar by 6th Grade
In terms of 6th grade, the demographic groups most similar to Immigrants from Burma/Myanmar are Immigrants from Dominica (95.7%, a difference of 0.020%), Immigrants (95.7%, a difference of 0.020%), Immigrants from Laos (95.7%, a difference of 0.030%), Sri Lankan (95.8%, a difference of 0.050%), and Bangladeshi (95.7%, a difference of 0.070%).
| Demographics | Rating | Rank | 6th Grade |
| Immigrants | Grenada | 0.0 /100 | #295 | Tragic 95.9% |
| Immigrants | South Eastern Asia | 0.0 /100 | #296 | Tragic 95.9% |
| Haitians | 0.0 /100 | #297 | Tragic 95.8% |
| Sri Lankans | 0.0 /100 | #298 | Tragic 95.8% |
| Immigrants | Laos | 0.0 /100 | #299 | Tragic 95.7% |
| Immigrants | Dominica | 0.0 /100 | #300 | Tragic 95.7% |
| Immigrants | Immigrants | 0.0 /100 | #301 | Tragic 95.7% |
| Immigrants | Burma/Myanmar | 0.0 /100 | #302 | Tragic 95.7% |
| Bangladeshis | 0.0 /100 | #303 | Tragic 95.7% |
| Indonesians | 0.0 /100 | #304 | Tragic 95.6% |
| Immigrants | Cuba | 0.0 /100 | #305 | Tragic 95.6% |
| Immigrants | Haiti | 0.0 /100 | #306 | Tragic 95.6% |
| Guyanese | 0.0 /100 | #307 | Tragic 95.6% |
| Immigrants | Caribbean | 0.0 /100 | #308 | Tragic 95.6% |
| Puerto Ricans | 0.0 /100 | #309 | Tragic 95.5% |