Scandinavian vs Moroccan 6th Grade
COMPARE
Scandinavian
Moroccan
6th Grade
6th Grade Comparison
Scandinavians
Moroccans
98.0%
6TH GRADE
100.0/ 100
METRIC RATING
28th/ 347
METRIC RANK
96.8%
6TH GRADE
9.0/ 100
METRIC RATING
212th/ 347
METRIC RANK
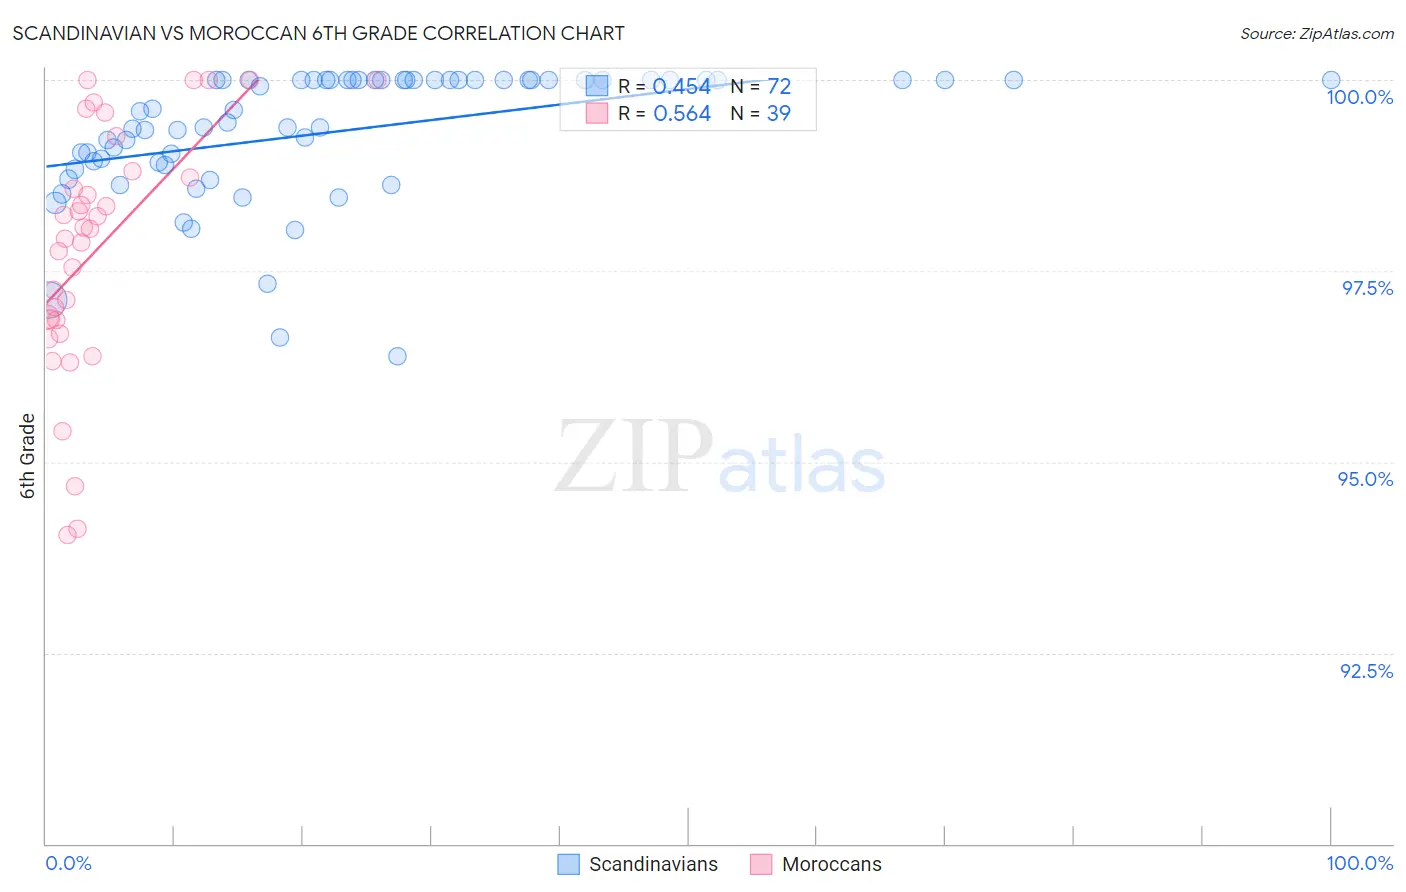
Scandinavian vs Moroccan 6th Grade Correlation Chart
The statistical analysis conducted on geographies consisting of 472,660,325 people shows a moderate positive correlation between the proportion of Scandinavians and percentage of population with at least 6th grade education in the United States with a correlation coefficient (R) of 0.454 and weighted average of 98.0%. Similarly, the statistical analysis conducted on geographies consisting of 201,817,667 people shows a substantial positive correlation between the proportion of Moroccans and percentage of population with at least 6th grade education in the United States with a correlation coefficient (R) of 0.564 and weighted average of 96.8%, a difference of 1.3%.
6th Grade Correlation Summary
| Measurement | Scandinavian | Moroccan |
| Minimum | 96.4% | 94.0% |
| Maximum | 100.0% | 100.0% |
| Range | 3.6% | 6.0% |
| Mean | 99.3% | 97.8% |
| Median | 99.6% | 98.1% |
| Interquartile 25% (IQ1) | 98.9% | 96.9% |
| Interquartile 75% (IQ3) | 100.0% | 98.8% |
| Interquartile Range (IQR) | 1.1% | 1.9% |
| Standard Deviation (Sample) | 0.85% | 1.6% |
| Standard Deviation (Population) | 0.85% | 1.6% |
Similar Demographics by 6th Grade
Demographics Similar to Scandinavians by 6th Grade
In terms of 6th grade, the demographic groups most similar to Scandinavians are Czech (98.0%, a difference of 0.0%), Yup'ik (98.0%, a difference of 0.0%), French (98.0%, a difference of 0.0%), French Canadian (98.0%, a difference of 0.010%), and European (98.0%, a difference of 0.010%).
| Demographics | Rating | Rank | 6th Grade |
| Lithuanians | 100.0 /100 | #21 | Exceptional 98.1% |
| Danes | 100.0 /100 | #22 | Exceptional 98.0% |
| Sioux | 100.0 /100 | #23 | Exceptional 98.0% |
| Croatians | 100.0 /100 | #24 | Exceptional 98.0% |
| Scotch-Irish | 100.0 /100 | #25 | Exceptional 98.0% |
| Czechs | 100.0 /100 | #26 | Exceptional 98.0% |
| Yup'ik | 100.0 /100 | #27 | Exceptional 98.0% |
| Scandinavians | 100.0 /100 | #28 | Exceptional 98.0% |
| French | 100.0 /100 | #29 | Exceptional 98.0% |
| French Canadians | 100.0 /100 | #30 | Exceptional 98.0% |
| Europeans | 100.0 /100 | #31 | Exceptional 98.0% |
| Alaska Natives | 100.0 /100 | #32 | Exceptional 98.0% |
| Chippewa | 100.0 /100 | #33 | Exceptional 97.9% |
| Swiss | 100.0 /100 | #34 | Exceptional 97.9% |
| Chinese | 100.0 /100 | #35 | Exceptional 97.9% |
Demographics Similar to Moroccans by 6th Grade
In terms of 6th grade, the demographic groups most similar to Moroccans are Immigrants from Iraq (96.8%, a difference of 0.0%), Immigrants from Sudan (96.8%, a difference of 0.0%), Portuguese (96.8%, a difference of 0.010%), Sierra Leonean (96.8%, a difference of 0.010%), and Immigrants from Nepal (96.8%, a difference of 0.020%).
| Demographics | Rating | Rank | 6th Grade |
| Natives/Alaskans | 13.0 /100 | #205 | Poor 96.8% |
| Laotians | 11.8 /100 | #206 | Poor 96.8% |
| Iraqis | 11.7 /100 | #207 | Poor 96.8% |
| Samoans | 11.0 /100 | #208 | Poor 96.8% |
| Immigrants | Oceania | 11.0 /100 | #209 | Poor 96.8% |
| Immigrants | Nepal | 10.1 /100 | #210 | Poor 96.8% |
| Immigrants | Iraq | 9.2 /100 | #211 | Tragic 96.8% |
| Moroccans | 9.0 /100 | #212 | Tragic 96.8% |
| Immigrants | Sudan | 8.7 /100 | #213 | Tragic 96.8% |
| Portuguese | 8.2 /100 | #214 | Tragic 96.8% |
| Sierra Leoneans | 8.0 /100 | #215 | Tragic 96.8% |
| Paiute | 7.8 /100 | #216 | Tragic 96.8% |
| Liberians | 7.5 /100 | #217 | Tragic 96.8% |
| Navajo | 7.3 /100 | #218 | Tragic 96.8% |
| Costa Ricans | 6.8 /100 | #219 | Tragic 96.8% |