Scandinavian vs Immigrants from Argentina 6th Grade
COMPARE
Scandinavian
Immigrants from Argentina
6th Grade
6th Grade Comparison
Scandinavians
Immigrants from Argentina
98.0%
6TH GRADE
100.0/ 100
METRIC RATING
28th/ 347
METRIC RANK
97.0%
6TH GRADE
30.4/ 100
METRIC RATING
188th/ 347
METRIC RANK
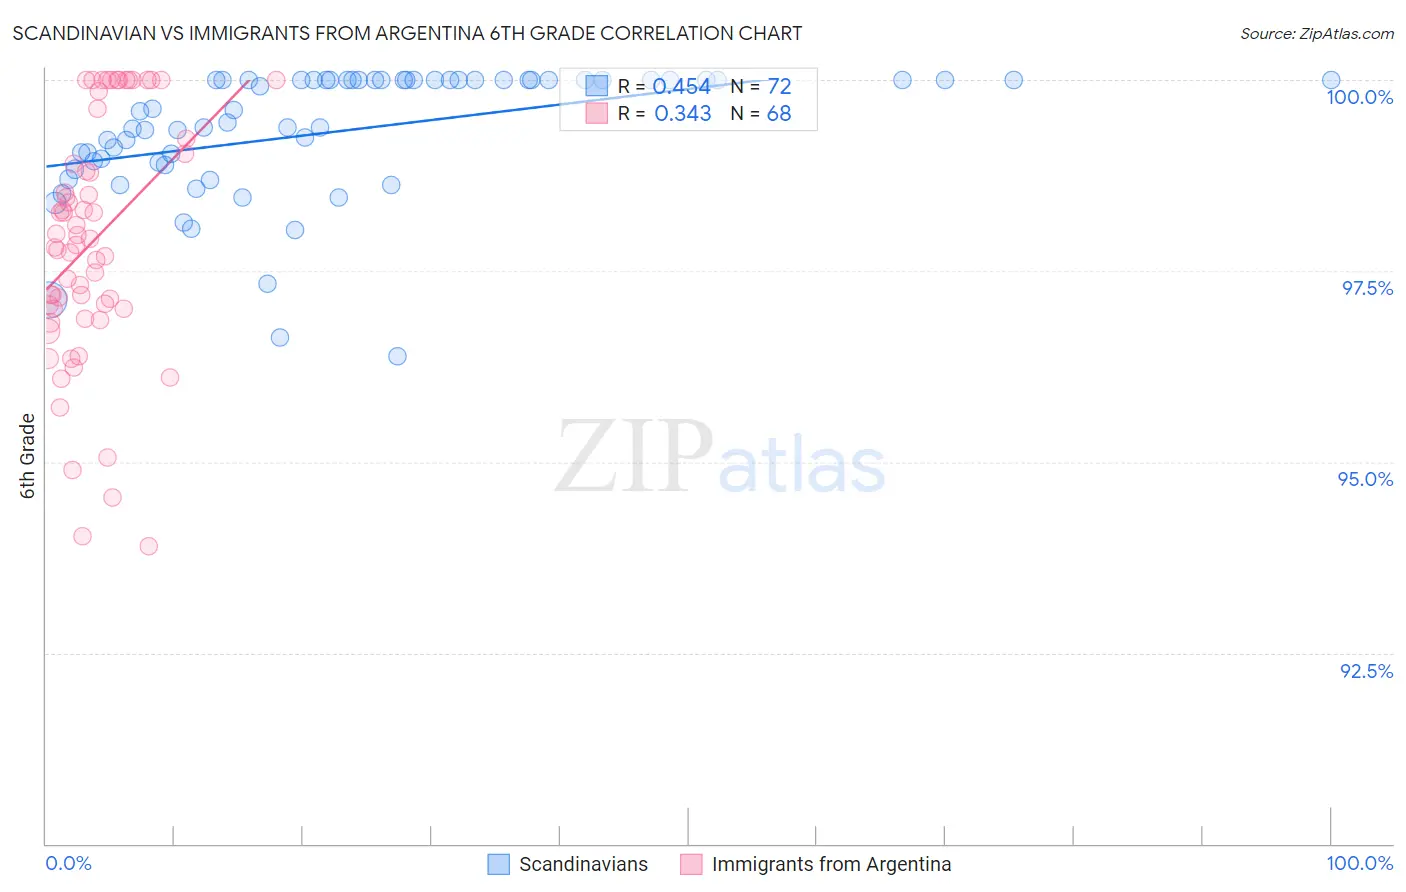
Scandinavian vs Immigrants from Argentina 6th Grade Correlation Chart
The statistical analysis conducted on geographies consisting of 472,660,325 people shows a moderate positive correlation between the proportion of Scandinavians and percentage of population with at least 6th grade education in the United States with a correlation coefficient (R) of 0.454 and weighted average of 98.0%. Similarly, the statistical analysis conducted on geographies consisting of 264,434,317 people shows a mild positive correlation between the proportion of Immigrants from Argentina and percentage of population with at least 6th grade education in the United States with a correlation coefficient (R) of 0.343 and weighted average of 97.0%, a difference of 1.1%.
6th Grade Correlation Summary
| Measurement | Scandinavian | Immigrants from Argentina |
| Minimum | 96.4% | 93.9% |
| Maximum | 100.0% | 100.0% |
| Range | 3.6% | 6.1% |
| Mean | 99.3% | 97.9% |
| Median | 99.6% | 97.9% |
| Interquartile 25% (IQ1) | 98.9% | 97.0% |
| Interquartile 75% (IQ3) | 100.0% | 99.1% |
| Interquartile Range (IQR) | 1.1% | 2.1% |
| Standard Deviation (Sample) | 0.85% | 1.6% |
| Standard Deviation (Population) | 0.85% | 1.6% |
Similar Demographics by 6th Grade
Demographics Similar to Scandinavians by 6th Grade
In terms of 6th grade, the demographic groups most similar to Scandinavians are Czech (98.0%, a difference of 0.0%), Yup'ik (98.0%, a difference of 0.0%), French (98.0%, a difference of 0.0%), French Canadian (98.0%, a difference of 0.010%), and European (98.0%, a difference of 0.010%).
| Demographics | Rating | Rank | 6th Grade |
| Lithuanians | 100.0 /100 | #21 | Exceptional 98.1% |
| Danes | 100.0 /100 | #22 | Exceptional 98.0% |
| Sioux | 100.0 /100 | #23 | Exceptional 98.0% |
| Croatians | 100.0 /100 | #24 | Exceptional 98.0% |
| Scotch-Irish | 100.0 /100 | #25 | Exceptional 98.0% |
| Czechs | 100.0 /100 | #26 | Exceptional 98.0% |
| Yup'ik | 100.0 /100 | #27 | Exceptional 98.0% |
| Scandinavians | 100.0 /100 | #28 | Exceptional 98.0% |
| French | 100.0 /100 | #29 | Exceptional 98.0% |
| French Canadians | 100.0 /100 | #30 | Exceptional 98.0% |
| Europeans | 100.0 /100 | #31 | Exceptional 98.0% |
| Alaska Natives | 100.0 /100 | #32 | Exceptional 98.0% |
| Chippewa | 100.0 /100 | #33 | Exceptional 97.9% |
| Swiss | 100.0 /100 | #34 | Exceptional 97.9% |
| Chinese | 100.0 /100 | #35 | Exceptional 97.9% |
Demographics Similar to Immigrants from Argentina by 6th Grade
In terms of 6th grade, the demographic groups most similar to Immigrants from Argentina are Guamanian/Chamorro (97.0%, a difference of 0.0%), Black/African American (97.0%, a difference of 0.0%), Argentinean (97.0%, a difference of 0.010%), Immigrants from Egypt (97.0%, a difference of 0.010%), and Dutch West Indian (96.9%, a difference of 0.010%).
| Demographics | Rating | Rank | 6th Grade |
| Comanche | 37.9 /100 | #181 | Fair 97.0% |
| Immigrants | Ukraine | 35.6 /100 | #182 | Fair 97.0% |
| Immigrants | Venezuela | 34.5 /100 | #183 | Fair 97.0% |
| Spanish Americans | 33.5 /100 | #184 | Fair 97.0% |
| Argentineans | 33.0 /100 | #185 | Fair 97.0% |
| Immigrants | Egypt | 31.4 /100 | #186 | Fair 97.0% |
| Guamanians/Chamorros | 30.6 /100 | #187 | Fair 97.0% |
| Immigrants | Argentina | 30.4 /100 | #188 | Fair 97.0% |
| Blacks/African Americans | 30.2 /100 | #189 | Fair 97.0% |
| Dutch West Indians | 28.3 /100 | #190 | Fair 96.9% |
| Panamanians | 27.3 /100 | #191 | Fair 96.9% |
| Hawaiians | 27.0 /100 | #192 | Fair 96.9% |
| Paraguayans | 26.6 /100 | #193 | Fair 96.9% |
| Immigrants | Lebanon | 25.6 /100 | #194 | Fair 96.9% |
| Immigrants | Brazil | 25.5 /100 | #195 | Fair 96.9% |