Immigrants from South Central Asia vs Immigrants from Burma/Myanmar 6th Grade
COMPARE
Immigrants from South Central Asia
Immigrants from Burma/Myanmar
6th Grade
6th Grade Comparison
Immigrants from South Central Asia
Immigrants from Burma/Myanmar
97.2%
6TH GRADE
78.1/ 100
METRIC RATING
147th/ 347
METRIC RANK
95.7%
6TH GRADE
0.0/ 100
METRIC RATING
302nd/ 347
METRIC RANK
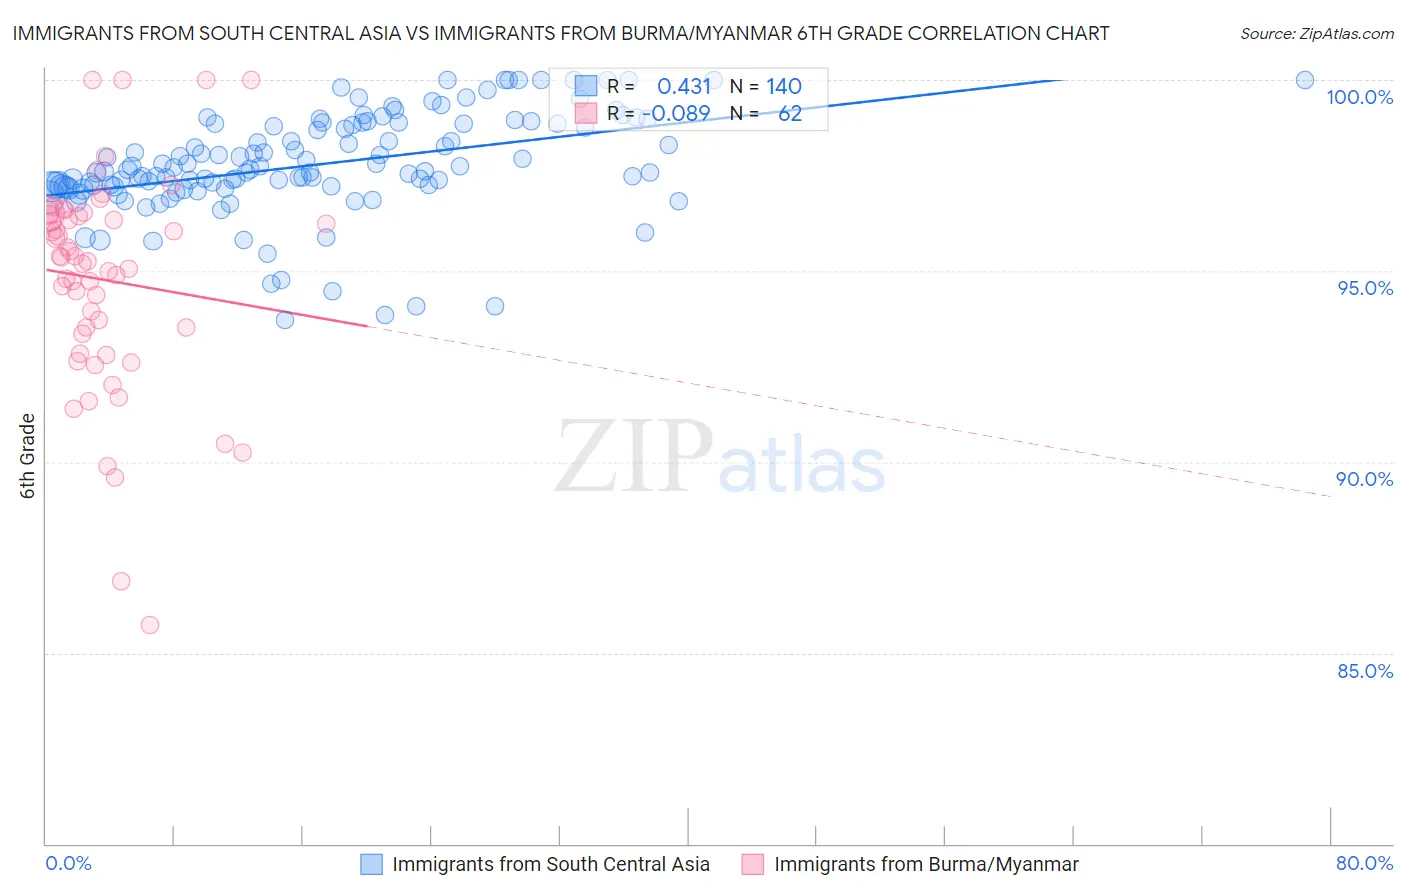
Immigrants from South Central Asia vs Immigrants from Burma/Myanmar 6th Grade Correlation Chart
The statistical analysis conducted on geographies consisting of 473,113,181 people shows a moderate positive correlation between the proportion of Immigrants from South Central Asia and percentage of population with at least 6th grade education in the United States with a correlation coefficient (R) of 0.431 and weighted average of 97.2%. Similarly, the statistical analysis conducted on geographies consisting of 172,326,083 people shows a slight negative correlation between the proportion of Immigrants from Burma/Myanmar and percentage of population with at least 6th grade education in the United States with a correlation coefficient (R) of -0.089 and weighted average of 95.7%, a difference of 1.5%.
6th Grade Correlation Summary
| Measurement | Immigrants from South Central Asia | Immigrants from Burma/Myanmar |
| Minimum | 93.7% | 85.7% |
| Maximum | 100.0% | 100.0% |
| Range | 6.3% | 14.3% |
| Mean | 97.8% | 94.8% |
| Median | 97.6% | 95.3% |
| Interquartile 25% (IQ1) | 97.2% | 93.4% |
| Interquartile 75% (IQ3) | 98.8% | 96.5% |
| Interquartile Range (IQR) | 1.6% | 3.1% |
| Standard Deviation (Sample) | 1.3% | 2.8% |
| Standard Deviation (Population) | 1.3% | 2.8% |
Similar Demographics by 6th Grade
Demographics Similar to Immigrants from South Central Asia by 6th Grade
In terms of 6th grade, the demographic groups most similar to Immigrants from South Central Asia are Immigrants from Greece (97.2%, a difference of 0.0%), Spaniard (97.2%, a difference of 0.010%), Hopi (97.2%, a difference of 0.010%), Immigrants from Israel (97.2%, a difference of 0.010%), and Immigrants from Bosnia and Herzegovina (97.2%, a difference of 0.020%).
| Demographics | Rating | Rank | 6th Grade |
| Immigrants | North Macedonia | 85.5 /100 | #140 | Excellent 97.2% |
| Seminole | 84.8 /100 | #141 | Excellent 97.2% |
| Jordanians | 84.6 /100 | #142 | Excellent 97.2% |
| Pima | 82.9 /100 | #143 | Excellent 97.2% |
| Israelis | 82.9 /100 | #144 | Excellent 97.2% |
| Spaniards | 80.1 /100 | #145 | Excellent 97.2% |
| Hopi | 78.8 /100 | #146 | Good 97.2% |
| Immigrants | South Central Asia | 78.1 /100 | #147 | Good 97.2% |
| Immigrants | Greece | 77.8 /100 | #148 | Good 97.2% |
| Immigrants | Israel | 76.0 /100 | #149 | Good 97.2% |
| Immigrants | Bosnia and Herzegovina | 74.8 /100 | #150 | Good 97.2% |
| French American Indians | 74.0 /100 | #151 | Good 97.2% |
| Immigrants | Jordan | 73.0 /100 | #152 | Good 97.2% |
| Immigrants | Eastern Europe | 72.6 /100 | #153 | Good 97.2% |
| Soviet Union | 71.5 /100 | #154 | Good 97.2% |
Demographics Similar to Immigrants from Burma/Myanmar by 6th Grade
In terms of 6th grade, the demographic groups most similar to Immigrants from Burma/Myanmar are Immigrants from Dominica (95.7%, a difference of 0.020%), Immigrants (95.7%, a difference of 0.020%), Immigrants from Laos (95.7%, a difference of 0.030%), Sri Lankan (95.8%, a difference of 0.050%), and Bangladeshi (95.7%, a difference of 0.070%).
| Demographics | Rating | Rank | 6th Grade |
| Immigrants | Grenada | 0.0 /100 | #295 | Tragic 95.9% |
| Immigrants | South Eastern Asia | 0.0 /100 | #296 | Tragic 95.9% |
| Haitians | 0.0 /100 | #297 | Tragic 95.8% |
| Sri Lankans | 0.0 /100 | #298 | Tragic 95.8% |
| Immigrants | Laos | 0.0 /100 | #299 | Tragic 95.7% |
| Immigrants | Dominica | 0.0 /100 | #300 | Tragic 95.7% |
| Immigrants | Immigrants | 0.0 /100 | #301 | Tragic 95.7% |
| Immigrants | Burma/Myanmar | 0.0 /100 | #302 | Tragic 95.7% |
| Bangladeshis | 0.0 /100 | #303 | Tragic 95.7% |
| Indonesians | 0.0 /100 | #304 | Tragic 95.6% |
| Immigrants | Cuba | 0.0 /100 | #305 | Tragic 95.6% |
| Immigrants | Haiti | 0.0 /100 | #306 | Tragic 95.6% |
| Guyanese | 0.0 /100 | #307 | Tragic 95.6% |
| Immigrants | Caribbean | 0.0 /100 | #308 | Tragic 95.6% |
| Puerto Ricans | 0.0 /100 | #309 | Tragic 95.5% |