Immigrants from Egypt vs Immigrants from Burma/Myanmar 6th Grade
COMPARE
Immigrants from Egypt
Immigrants from Burma/Myanmar
6th Grade
6th Grade Comparison
Immigrants from Egypt
Immigrants from Burma/Myanmar
97.0%
6TH GRADE
31.4/ 100
METRIC RATING
186th/ 347
METRIC RANK
95.7%
6TH GRADE
0.0/ 100
METRIC RATING
302nd/ 347
METRIC RANK
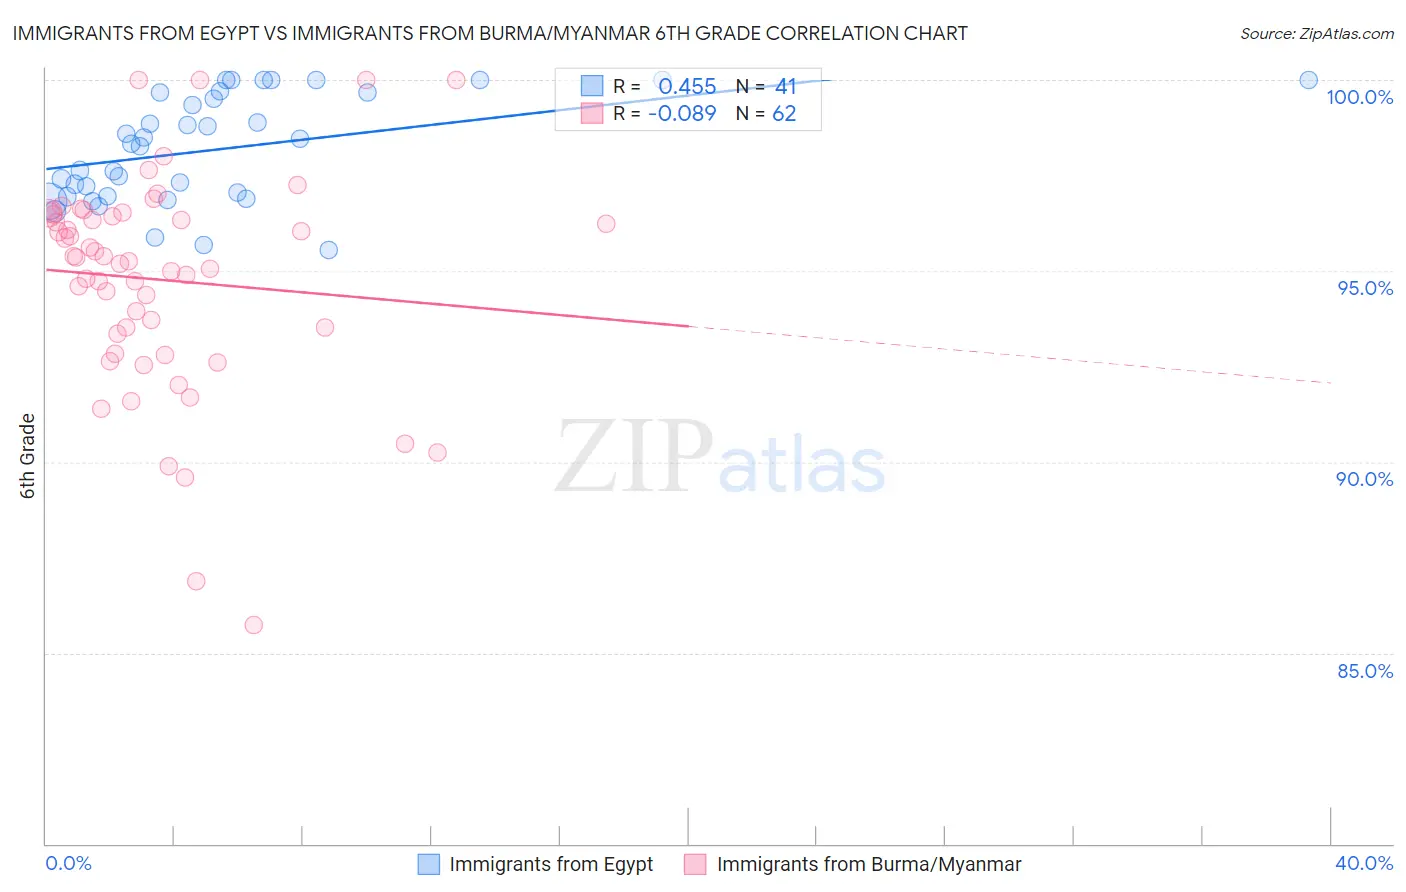
Immigrants from Egypt vs Immigrants from Burma/Myanmar 6th Grade Correlation Chart
The statistical analysis conducted on geographies consisting of 245,485,794 people shows a moderate positive correlation between the proportion of Immigrants from Egypt and percentage of population with at least 6th grade education in the United States with a correlation coefficient (R) of 0.455 and weighted average of 97.0%. Similarly, the statistical analysis conducted on geographies consisting of 172,326,083 people shows a slight negative correlation between the proportion of Immigrants from Burma/Myanmar and percentage of population with at least 6th grade education in the United States with a correlation coefficient (R) of -0.089 and weighted average of 95.7%, a difference of 1.3%.
6th Grade Correlation Summary
| Measurement | Immigrants from Egypt | Immigrants from Burma/Myanmar |
| Minimum | 95.5% | 85.7% |
| Maximum | 100.0% | 100.0% |
| Range | 4.5% | 14.3% |
| Mean | 98.2% | 94.8% |
| Median | 98.3% | 95.3% |
| Interquartile 25% (IQ1) | 96.9% | 93.4% |
| Interquartile 75% (IQ3) | 99.7% | 96.5% |
| Interquartile Range (IQR) | 2.7% | 3.1% |
| Standard Deviation (Sample) | 1.4% | 2.8% |
| Standard Deviation (Population) | 1.4% | 2.8% |
Similar Demographics by 6th Grade
Demographics Similar to Immigrants from Egypt by 6th Grade
In terms of 6th grade, the demographic groups most similar to Immigrants from Egypt are Guamanian/Chamorro (97.0%, a difference of 0.0%), Spanish American (97.0%, a difference of 0.010%), Argentinean (97.0%, a difference of 0.010%), Immigrants from Argentina (97.0%, a difference of 0.010%), and Black/African American (97.0%, a difference of 0.010%).
| Demographics | Rating | Rank | 6th Grade |
| Immigrants | Kenya | 45.3 /100 | #179 | Average 97.0% |
| Immigrants | Spain | 39.9 /100 | #180 | Fair 97.0% |
| Comanche | 37.9 /100 | #181 | Fair 97.0% |
| Immigrants | Ukraine | 35.6 /100 | #182 | Fair 97.0% |
| Immigrants | Venezuela | 34.5 /100 | #183 | Fair 97.0% |
| Spanish Americans | 33.5 /100 | #184 | Fair 97.0% |
| Argentineans | 33.0 /100 | #185 | Fair 97.0% |
| Immigrants | Egypt | 31.4 /100 | #186 | Fair 97.0% |
| Guamanians/Chamorros | 30.6 /100 | #187 | Fair 97.0% |
| Immigrants | Argentina | 30.4 /100 | #188 | Fair 97.0% |
| Blacks/African Americans | 30.2 /100 | #189 | Fair 97.0% |
| Dutch West Indians | 28.3 /100 | #190 | Fair 96.9% |
| Panamanians | 27.3 /100 | #191 | Fair 96.9% |
| Hawaiians | 27.0 /100 | #192 | Fair 96.9% |
| Paraguayans | 26.6 /100 | #193 | Fair 96.9% |
Demographics Similar to Immigrants from Burma/Myanmar by 6th Grade
In terms of 6th grade, the demographic groups most similar to Immigrants from Burma/Myanmar are Immigrants from Dominica (95.7%, a difference of 0.020%), Immigrants (95.7%, a difference of 0.020%), Immigrants from Laos (95.7%, a difference of 0.030%), Sri Lankan (95.8%, a difference of 0.050%), and Bangladeshi (95.7%, a difference of 0.070%).
| Demographics | Rating | Rank | 6th Grade |
| Immigrants | Grenada | 0.0 /100 | #295 | Tragic 95.9% |
| Immigrants | South Eastern Asia | 0.0 /100 | #296 | Tragic 95.9% |
| Haitians | 0.0 /100 | #297 | Tragic 95.8% |
| Sri Lankans | 0.0 /100 | #298 | Tragic 95.8% |
| Immigrants | Laos | 0.0 /100 | #299 | Tragic 95.7% |
| Immigrants | Dominica | 0.0 /100 | #300 | Tragic 95.7% |
| Immigrants | Immigrants | 0.0 /100 | #301 | Tragic 95.7% |
| Immigrants | Burma/Myanmar | 0.0 /100 | #302 | Tragic 95.7% |
| Bangladeshis | 0.0 /100 | #303 | Tragic 95.7% |
| Indonesians | 0.0 /100 | #304 | Tragic 95.6% |
| Immigrants | Cuba | 0.0 /100 | #305 | Tragic 95.6% |
| Immigrants | Haiti | 0.0 /100 | #306 | Tragic 95.6% |
| Guyanese | 0.0 /100 | #307 | Tragic 95.6% |
| Immigrants | Caribbean | 0.0 /100 | #308 | Tragic 95.6% |
| Puerto Ricans | 0.0 /100 | #309 | Tragic 95.5% |