Immigrants from Philippines vs Choctaw College, Under 1 year
COMPARE
Immigrants from Philippines
Choctaw
College, Under 1 year
College, Under 1 year Comparison
Immigrants from Philippines
Choctaw
64.8%
COLLEGE, UNDER 1 YEAR
30.1/ 100
METRIC RATING
190th/ 347
METRIC RANK
59.3%
COLLEGE, UNDER 1 YEAR
0.0/ 100
METRIC RATING
289th/ 347
METRIC RANK
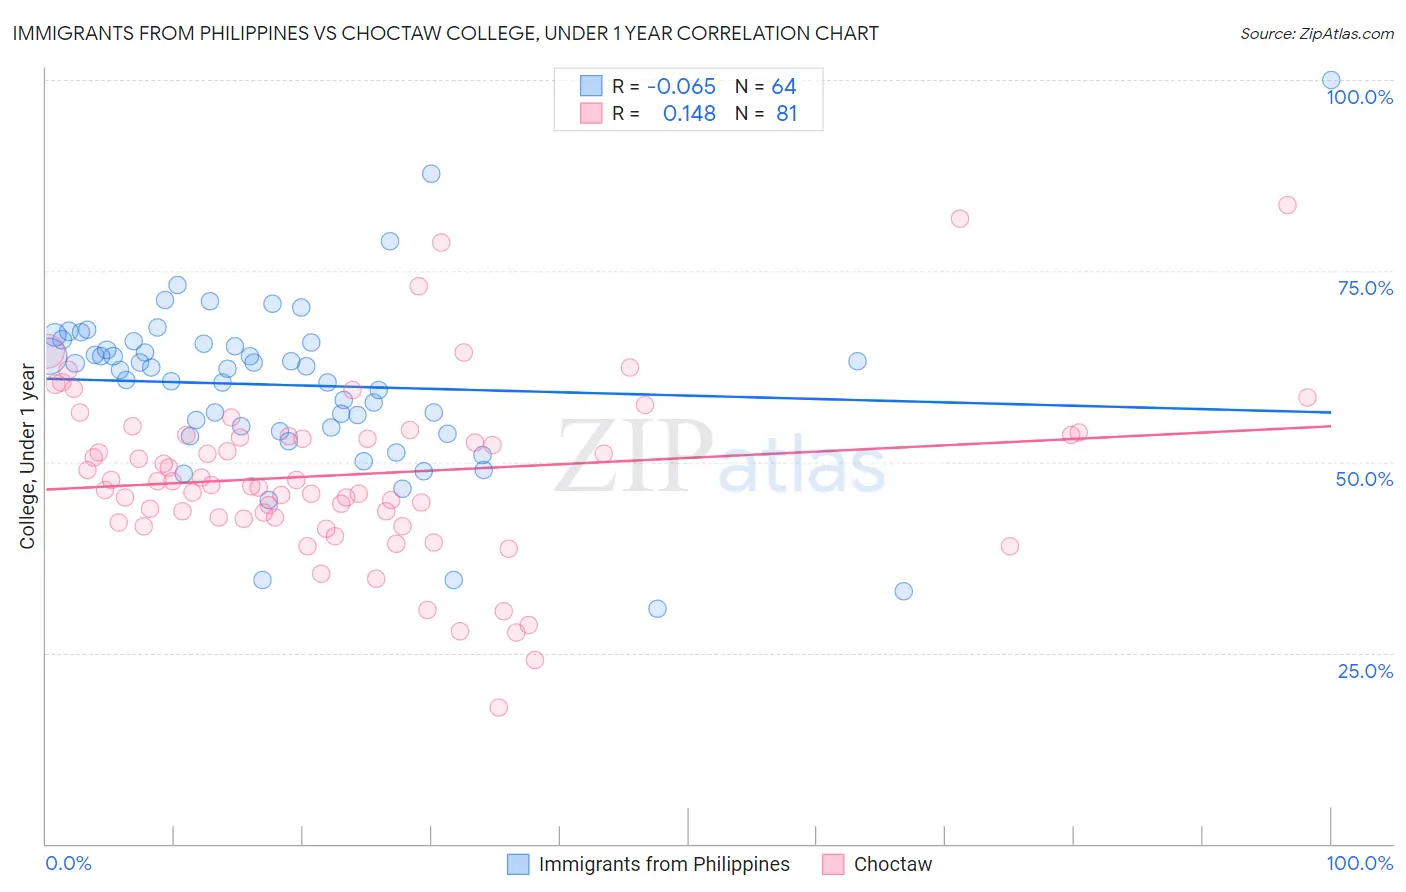
Immigrants from Philippines vs Choctaw College, Under 1 year Correlation Chart
The statistical analysis conducted on geographies consisting of 471,303,871 people shows a slight negative correlation between the proportion of Immigrants from Philippines and percentage of population with at least college, under 1 year education in the United States with a correlation coefficient (R) of -0.065 and weighted average of 64.8%. Similarly, the statistical analysis conducted on geographies consisting of 269,741,683 people shows a poor positive correlation between the proportion of Choctaw and percentage of population with at least college, under 1 year education in the United States with a correlation coefficient (R) of 0.148 and weighted average of 59.3%, a difference of 9.2%.
College, Under 1 year Correlation Summary
| Measurement | Immigrants from Philippines | Choctaw |
| Minimum | 30.7% | 17.8% |
| Maximum | 100.0% | 83.7% |
| Range | 69.3% | 65.9% |
| Mean | 60.1% | 48.4% |
| Median | 62.3% | 47.4% |
| Interquartile 25% (IQ1) | 54.2% | 42.6% |
| Interquartile 75% (IQ3) | 65.6% | 53.5% |
| Interquartile Range (IQR) | 11.3% | 10.9% |
| Standard Deviation (Sample) | 11.4% | 11.6% |
| Standard Deviation (Population) | 11.3% | 11.5% |
Similar Demographics by College, Under 1 year
Demographics Similar to Immigrants from Philippines by College, Under 1 year
In terms of college, under 1 year, the demographic groups most similar to Immigrants from Philippines are Spanish (64.9%, a difference of 0.080%), Immigrants from Albania (64.9%, a difference of 0.10%), Immigrants from Armenia (64.7%, a difference of 0.11%), Immigrants from Thailand (64.7%, a difference of 0.17%), and Slovak (64.7%, a difference of 0.19%).
| Demographics | Rating | Rank | College, Under 1 year |
| Immigrants | Poland | 42.6 /100 | #183 | Average 65.2% |
| Bermudans | 42.0 /100 | #184 | Average 65.2% |
| Sri Lankans | 41.7 /100 | #185 | Average 65.2% |
| Immigrants | Sierra Leone | 39.7 /100 | #186 | Fair 65.1% |
| Immigrants | Southern Europe | 34.3 /100 | #187 | Fair 64.9% |
| Immigrants | Albania | 32.0 /100 | #188 | Fair 64.9% |
| Spanish | 31.6 /100 | #189 | Fair 64.9% |
| Immigrants | Philippines | 30.1 /100 | #190 | Fair 64.8% |
| Immigrants | Armenia | 28.1 /100 | #191 | Fair 64.7% |
| Immigrants | Thailand | 27.0 /100 | #192 | Fair 64.7% |
| Slovaks | 26.7 /100 | #193 | Fair 64.7% |
| Immigrants | Cameroon | 24.6 /100 | #194 | Fair 64.6% |
| Immigrants | South Eastern Asia | 22.1 /100 | #195 | Fair 64.5% |
| Tongans | 21.2 /100 | #196 | Fair 64.5% |
| Costa Ricans | 19.6 /100 | #197 | Poor 64.4% |
Demographics Similar to Choctaw by College, Under 1 year
In terms of college, under 1 year, the demographic groups most similar to Choctaw are Ecuadorian (59.3%, a difference of 0.040%), Black/African American (59.4%, a difference of 0.070%), Creek (59.3%, a difference of 0.13%), Sioux (59.4%, a difference of 0.17%), and Nicaraguan (59.2%, a difference of 0.17%).
| Demographics | Rating | Rank | College, Under 1 year |
| Belizeans | 0.1 /100 | #282 | Tragic 60.1% |
| Immigrants | Jamaica | 0.0 /100 | #283 | Tragic 59.7% |
| Immigrants | St. Vincent and the Grenadines | 0.0 /100 | #284 | Tragic 59.6% |
| Paiute | 0.0 /100 | #285 | Tragic 59.6% |
| British West Indians | 0.0 /100 | #286 | Tragic 59.5% |
| Sioux | 0.0 /100 | #287 | Tragic 59.4% |
| Blacks/African Americans | 0.0 /100 | #288 | Tragic 59.4% |
| Choctaw | 0.0 /100 | #289 | Tragic 59.3% |
| Ecuadorians | 0.0 /100 | #290 | Tragic 59.3% |
| Creek | 0.0 /100 | #291 | Tragic 59.3% |
| Nicaraguans | 0.0 /100 | #292 | Tragic 59.2% |
| Seminole | 0.0 /100 | #293 | Tragic 59.1% |
| Immigrants | Belize | 0.0 /100 | #294 | Tragic 59.1% |
| Immigrants | Grenada | 0.0 /100 | #295 | Tragic 59.1% |
| Central American Indians | 0.0 /100 | #296 | Tragic 59.0% |