German Russian vs Choctaw College, Under 1 year
COMPARE
German Russian
Choctaw
College, Under 1 year
College, Under 1 year Comparison
German Russians
Choctaw
65.4%
COLLEGE, UNDER 1 YEAR
48.3/ 100
METRIC RATING
178th/ 347
METRIC RANK
59.3%
COLLEGE, UNDER 1 YEAR
0.0/ 100
METRIC RATING
289th/ 347
METRIC RANK
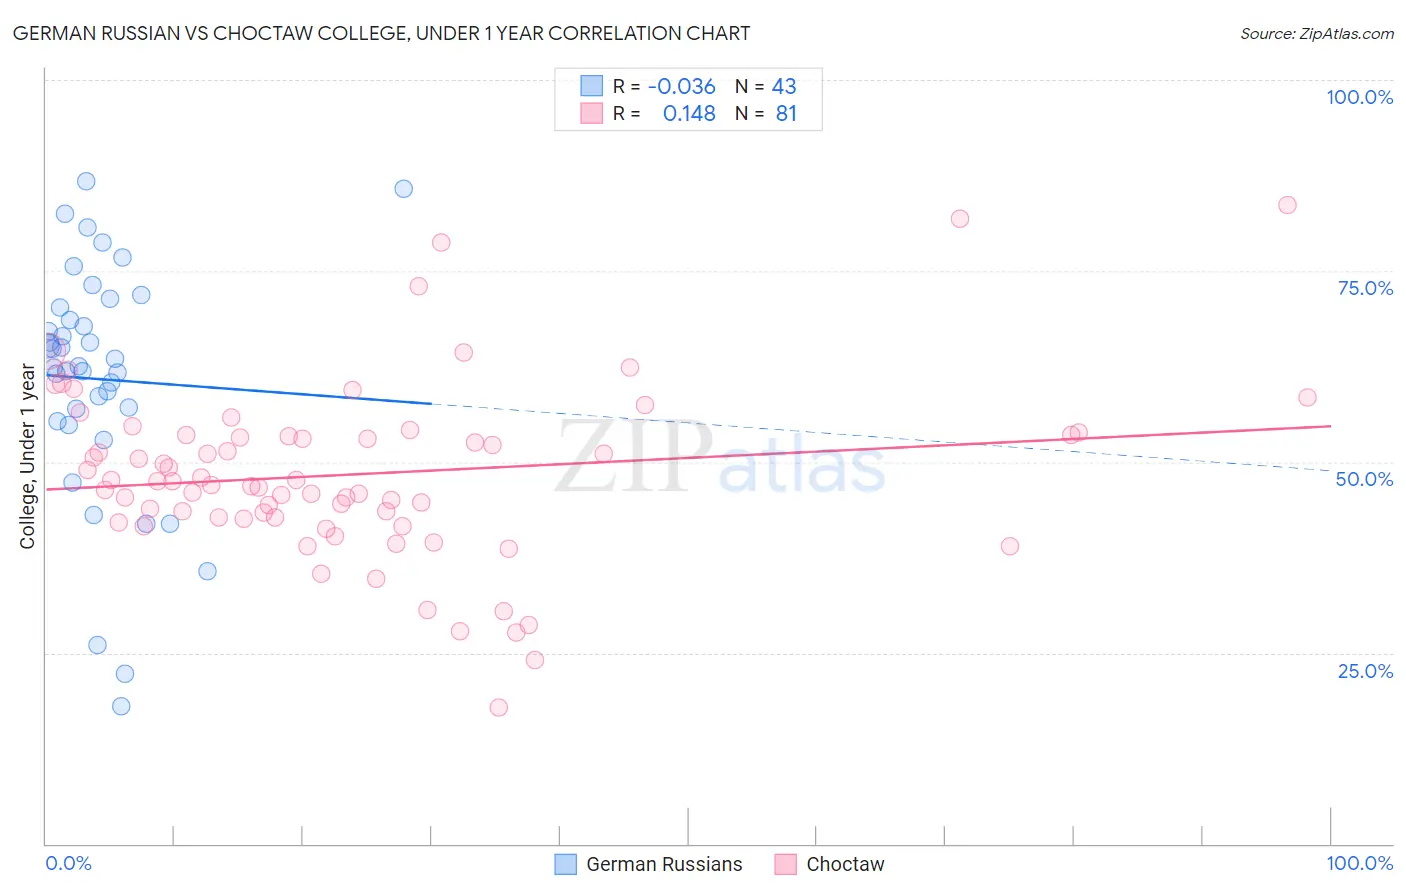
German Russian vs Choctaw College, Under 1 year Correlation Chart
The statistical analysis conducted on geographies consisting of 96,461,984 people shows no correlation between the proportion of German Russians and percentage of population with at least college, under 1 year education in the United States with a correlation coefficient (R) of -0.036 and weighted average of 65.4%. Similarly, the statistical analysis conducted on geographies consisting of 269,741,683 people shows a poor positive correlation between the proportion of Choctaw and percentage of population with at least college, under 1 year education in the United States with a correlation coefficient (R) of 0.148 and weighted average of 59.3%, a difference of 10.1%.
College, Under 1 year Correlation Summary
| Measurement | German Russian | Choctaw |
| Minimum | 18.0% | 17.8% |
| Maximum | 86.7% | 83.7% |
| Range | 68.7% | 65.9% |
| Mean | 60.8% | 48.4% |
| Median | 62.5% | 47.4% |
| Interquartile 25% (IQ1) | 55.4% | 42.6% |
| Interquartile 75% (IQ3) | 70.2% | 53.5% |
| Interquartile Range (IQR) | 14.8% | 10.9% |
| Standard Deviation (Sample) | 15.6% | 11.6% |
| Standard Deviation (Population) | 15.4% | 11.5% |
Similar Demographics by College, Under 1 year
Demographics Similar to German Russians by College, Under 1 year
In terms of college, under 1 year, the demographic groups most similar to German Russians are Guamanian/Chamorro (65.4%, a difference of 0.0%), Immigrants from North Macedonia (65.4%, a difference of 0.010%), French (65.4%, a difference of 0.030%), Scotch-Irish (65.4%, a difference of 0.050%), and Immigrants from Bosnia and Herzegovina (65.4%, a difference of 0.080%).
| Demographics | Rating | Rank | College, Under 1 year |
| Immigrants | Oceania | 55.0 /100 | #171 | Average 65.6% |
| South American Indians | 54.4 /100 | #172 | Average 65.5% |
| Swiss | 53.9 /100 | #173 | Average 65.5% |
| Immigrants | Bosnia and Herzegovina | 50.0 /100 | #174 | Average 65.4% |
| Scotch-Irish | 49.5 /100 | #175 | Average 65.4% |
| French | 48.9 /100 | #176 | Average 65.4% |
| Immigrants | North Macedonia | 48.6 /100 | #177 | Average 65.4% |
| German Russians | 48.3 /100 | #178 | Average 65.4% |
| Guamanians/Chamorros | 48.2 /100 | #179 | Average 65.4% |
| Dutch | 46.1 /100 | #180 | Average 65.3% |
| Spaniards | 45.5 /100 | #181 | Average 65.3% |
| Immigrants | Africa | 44.7 /100 | #182 | Average 65.3% |
| Immigrants | Poland | 42.6 /100 | #183 | Average 65.2% |
| Bermudans | 42.0 /100 | #184 | Average 65.2% |
| Sri Lankans | 41.7 /100 | #185 | Average 65.2% |
Demographics Similar to Choctaw by College, Under 1 year
In terms of college, under 1 year, the demographic groups most similar to Choctaw are Ecuadorian (59.3%, a difference of 0.040%), Black/African American (59.4%, a difference of 0.070%), Creek (59.3%, a difference of 0.13%), Sioux (59.4%, a difference of 0.17%), and Nicaraguan (59.2%, a difference of 0.17%).
| Demographics | Rating | Rank | College, Under 1 year |
| Belizeans | 0.1 /100 | #282 | Tragic 60.1% |
| Immigrants | Jamaica | 0.0 /100 | #283 | Tragic 59.7% |
| Immigrants | St. Vincent and the Grenadines | 0.0 /100 | #284 | Tragic 59.6% |
| Paiute | 0.0 /100 | #285 | Tragic 59.6% |
| British West Indians | 0.0 /100 | #286 | Tragic 59.5% |
| Sioux | 0.0 /100 | #287 | Tragic 59.4% |
| Blacks/African Americans | 0.0 /100 | #288 | Tragic 59.4% |
| Choctaw | 0.0 /100 | #289 | Tragic 59.3% |
| Ecuadorians | 0.0 /100 | #290 | Tragic 59.3% |
| Creek | 0.0 /100 | #291 | Tragic 59.3% |
| Nicaraguans | 0.0 /100 | #292 | Tragic 59.2% |
| Seminole | 0.0 /100 | #293 | Tragic 59.1% |
| Immigrants | Belize | 0.0 /100 | #294 | Tragic 59.1% |
| Immigrants | Grenada | 0.0 /100 | #295 | Tragic 59.1% |
| Central American Indians | 0.0 /100 | #296 | Tragic 59.0% |