Sri Lankan vs Blackfeet Bachelor's Degree
COMPARE
Sri Lankan
Blackfeet
Bachelor's Degree
Bachelor's Degree Comparison
Sri Lankans
Blackfeet
38.2%
BACHELOR'S DEGREE
59.1/ 100
METRIC RATING
165th/ 347
METRIC RANK
31.5%
BACHELOR'S DEGREE
0.1/ 100
METRIC RATING
281st/ 347
METRIC RANK
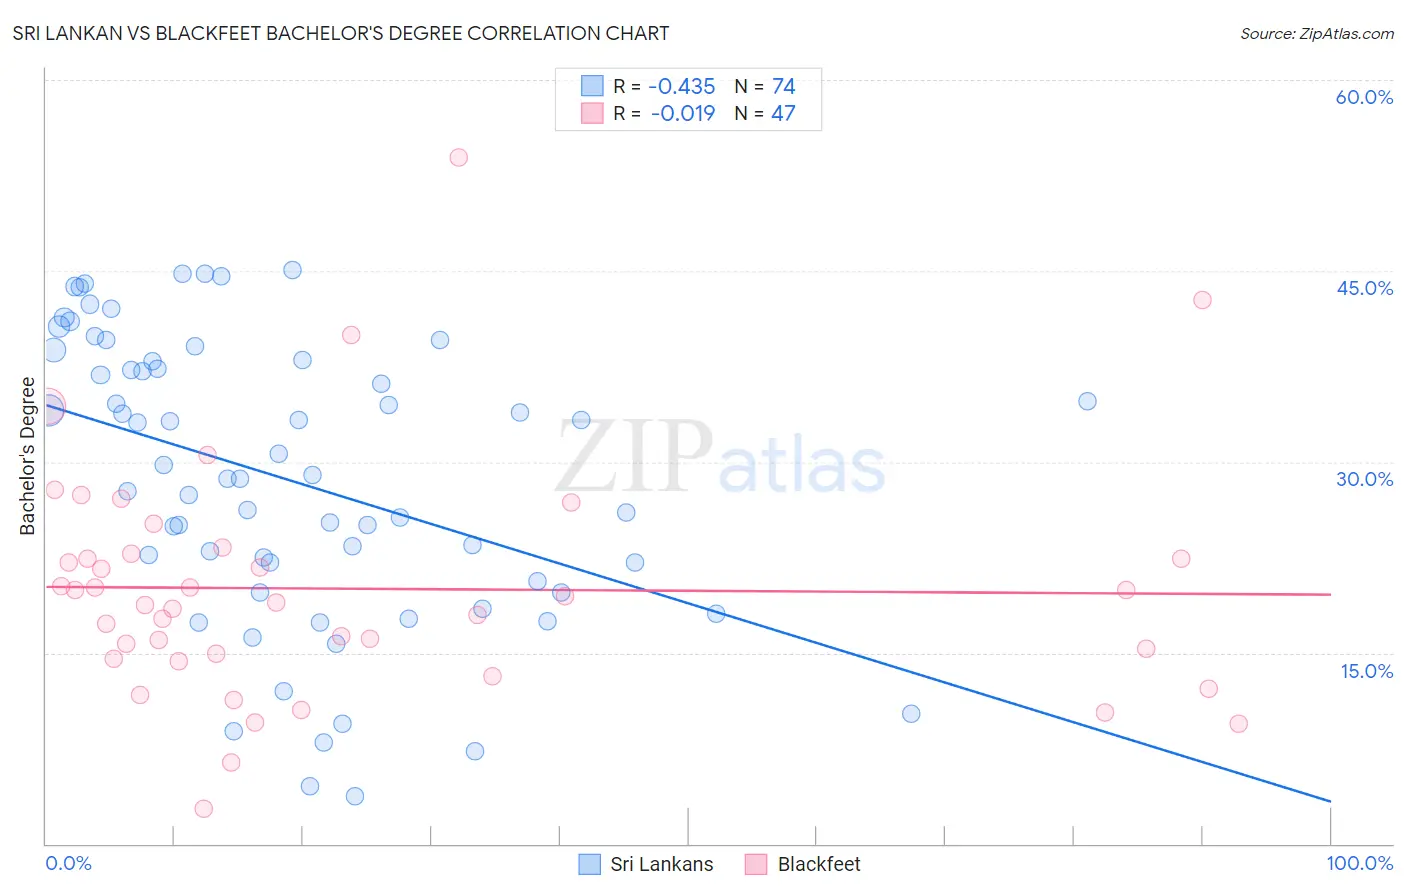
Sri Lankan vs Blackfeet Bachelor's Degree Correlation Chart
The statistical analysis conducted on geographies consisting of 440,520,330 people shows a moderate negative correlation between the proportion of Sri Lankans and percentage of population with at least bachelor's degree education in the United States with a correlation coefficient (R) of -0.435 and weighted average of 38.2%. Similarly, the statistical analysis conducted on geographies consisting of 309,572,502 people shows no correlation between the proportion of Blackfeet and percentage of population with at least bachelor's degree education in the United States with a correlation coefficient (R) of -0.019 and weighted average of 31.5%, a difference of 21.3%.
Bachelor's Degree Correlation Summary
| Measurement | Sri Lankan | Blackfeet |
| Minimum | 3.7% | 2.7% |
| Maximum | 45.1% | 53.9% |
| Range | 41.4% | 51.2% |
| Mean | 28.6% | 20.0% |
| Median | 28.8% | 18.9% |
| Interquartile 25% (IQ1) | 20.6% | 14.5% |
| Interquartile 75% (IQ3) | 37.9% | 22.7% |
| Interquartile Range (IQR) | 17.3% | 8.2% |
| Standard Deviation (Sample) | 11.1% | 9.3% |
| Standard Deviation (Population) | 11.0% | 9.2% |
Similar Demographics by Bachelor's Degree
Demographics Similar to Sri Lankans by Bachelor's Degree
In terms of bachelor's degree, the demographic groups most similar to Sri Lankans are Somali (38.1%, a difference of 0.050%), Scottish (38.1%, a difference of 0.25%), Danish (38.1%, a difference of 0.29%), Hungarian (38.3%, a difference of 0.30%), and Ghanaian (38.0%, a difference of 0.37%).
| Demographics | Rating | Rank | Bachelor's Degree |
| Immigrants | Germany | 69.6 /100 | #158 | Good 38.6% |
| Chinese | 66.6 /100 | #159 | Good 38.5% |
| Vietnamese | 66.6 /100 | #160 | Good 38.5% |
| Uruguayans | 65.8 /100 | #161 | Good 38.4% |
| Colombians | 65.0 /100 | #162 | Good 38.4% |
| Peruvians | 63.4 /100 | #163 | Good 38.3% |
| Hungarians | 62.1 /100 | #164 | Good 38.3% |
| Sri Lankans | 59.1 /100 | #165 | Average 38.2% |
| Somalis | 58.6 /100 | #166 | Average 38.1% |
| Scottish | 56.6 /100 | #167 | Average 38.1% |
| Danes | 56.2 /100 | #168 | Average 38.1% |
| Ghanaians | 55.3 /100 | #169 | Average 38.0% |
| Czechs | 54.4 /100 | #170 | Average 38.0% |
| Bermudans | 54.2 /100 | #171 | Average 38.0% |
| Immigrants | Somalia | 52.8 /100 | #172 | Average 37.9% |
Demographics Similar to Blackfeet by Bachelor's Degree
In terms of bachelor's degree, the demographic groups most similar to Blackfeet are Immigrants from Caribbean (31.4%, a difference of 0.15%), Honduran (31.3%, a difference of 0.42%), Haitian (31.3%, a difference of 0.45%), Immigrants from Laos (31.6%, a difference of 0.46%), and Aleut (31.3%, a difference of 0.47%).
| Demographics | Rating | Rank | Bachelor's Degree |
| Potawatomi | 0.2 /100 | #274 | Tragic 31.9% |
| Samoans | 0.1 /100 | #275 | Tragic 31.8% |
| Salvadorans | 0.1 /100 | #276 | Tragic 31.8% |
| Dominicans | 0.1 /100 | #277 | Tragic 31.8% |
| Marshallese | 0.1 /100 | #278 | Tragic 31.7% |
| Hawaiians | 0.1 /100 | #279 | Tragic 31.6% |
| Immigrants | Laos | 0.1 /100 | #280 | Tragic 31.6% |
| Blackfeet | 0.1 /100 | #281 | Tragic 31.5% |
| Immigrants | Caribbean | 0.1 /100 | #282 | Tragic 31.4% |
| Hondurans | 0.1 /100 | #283 | Tragic 31.3% |
| Haitians | 0.1 /100 | #284 | Tragic 31.3% |
| Aleuts | 0.1 /100 | #285 | Tragic 31.3% |
| Immigrants | El Salvador | 0.1 /100 | #286 | Tragic 31.3% |
| Ottawa | 0.1 /100 | #287 | Tragic 31.1% |
| Guatemalans | 0.1 /100 | #288 | Tragic 31.0% |