Cuban vs Sri Lankan Bachelor's Degree
COMPARE
Cuban
Sri Lankan
Bachelor's Degree
Bachelor's Degree Comparison
Cubans
Sri Lankans
32.5%
BACHELOR'S DEGREE
0.3/ 100
METRIC RATING
267th/ 347
METRIC RANK
38.2%
BACHELOR'S DEGREE
59.1/ 100
METRIC RATING
165th/ 347
METRIC RANK
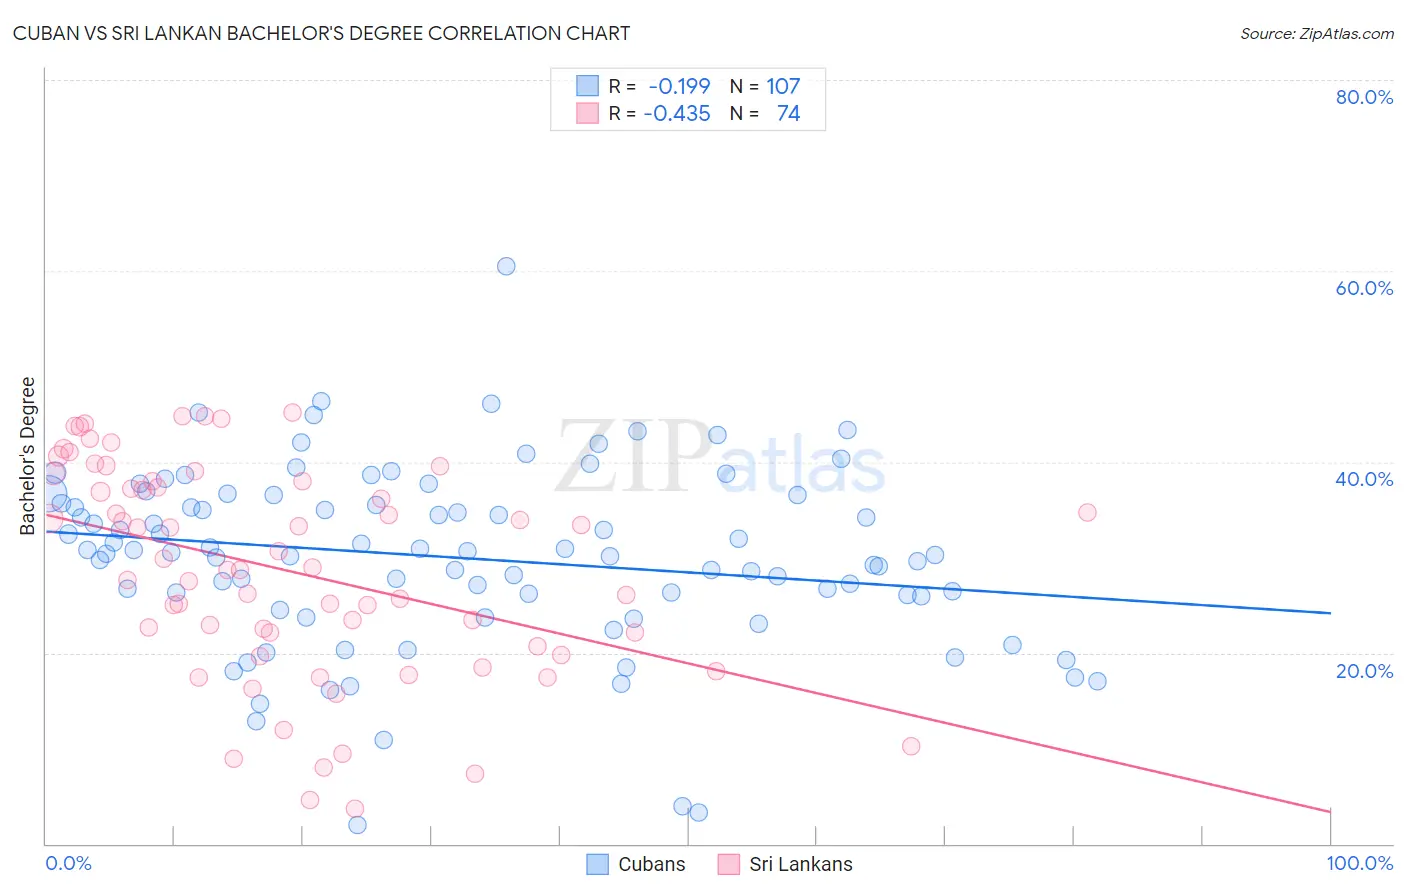
Cuban vs Sri Lankan Bachelor's Degree Correlation Chart
The statistical analysis conducted on geographies consisting of 449,220,145 people shows a poor negative correlation between the proportion of Cubans and percentage of population with at least bachelor's degree education in the United States with a correlation coefficient (R) of -0.199 and weighted average of 32.5%. Similarly, the statistical analysis conducted on geographies consisting of 440,520,330 people shows a moderate negative correlation between the proportion of Sri Lankans and percentage of population with at least bachelor's degree education in the United States with a correlation coefficient (R) of -0.435 and weighted average of 38.2%, a difference of 17.5%.
Bachelor's Degree Correlation Summary
| Measurement | Cuban | Sri Lankan |
| Minimum | 2.0% | 3.7% |
| Maximum | 60.5% | 45.1% |
| Range | 58.5% | 41.4% |
| Mean | 30.0% | 28.6% |
| Median | 30.6% | 28.8% |
| Interquartile 25% (IQ1) | 25.9% | 20.6% |
| Interquartile 75% (IQ3) | 36.5% | 37.9% |
| Interquartile Range (IQR) | 10.6% | 17.3% |
| Standard Deviation (Sample) | 9.5% | 11.1% |
| Standard Deviation (Population) | 9.5% | 11.0% |
Similar Demographics by Bachelor's Degree
Demographics Similar to Cubans by Bachelor's Degree
In terms of bachelor's degree, the demographic groups most similar to Cubans are Immigrants from Dominica (32.5%, a difference of 0.12%), Bahamian (32.5%, a difference of 0.15%), Central American Indian (32.5%, a difference of 0.18%), Immigrants from Portugal (32.2%, a difference of 0.76%), and Belizean (32.8%, a difference of 0.96%).
| Demographics | Rating | Rank | Bachelor's Degree |
| Malaysians | 0.5 /100 | #260 | Tragic 32.9% |
| Africans | 0.5 /100 | #261 | Tragic 32.9% |
| Immigrants | Jamaica | 0.5 /100 | #262 | Tragic 32.9% |
| Belizeans | 0.4 /100 | #263 | Tragic 32.8% |
| Central American Indians | 0.3 /100 | #264 | Tragic 32.5% |
| Bahamians | 0.3 /100 | #265 | Tragic 32.5% |
| Immigrants | Dominica | 0.3 /100 | #266 | Tragic 32.5% |
| Cubans | 0.3 /100 | #267 | Tragic 32.5% |
| Immigrants | Portugal | 0.2 /100 | #268 | Tragic 32.2% |
| Immigrants | Belize | 0.2 /100 | #269 | Tragic 32.1% |
| Immigrants | Nicaragua | 0.2 /100 | #270 | Tragic 31.9% |
| Central Americans | 0.2 /100 | #271 | Tragic 31.9% |
| Comanche | 0.2 /100 | #272 | Tragic 31.9% |
| Americans | 0.2 /100 | #273 | Tragic 31.9% |
| Potawatomi | 0.2 /100 | #274 | Tragic 31.9% |
Demographics Similar to Sri Lankans by Bachelor's Degree
In terms of bachelor's degree, the demographic groups most similar to Sri Lankans are Somali (38.1%, a difference of 0.050%), Scottish (38.1%, a difference of 0.25%), Danish (38.1%, a difference of 0.29%), Hungarian (38.3%, a difference of 0.30%), and Ghanaian (38.0%, a difference of 0.37%).
| Demographics | Rating | Rank | Bachelor's Degree |
| Immigrants | Germany | 69.6 /100 | #158 | Good 38.6% |
| Chinese | 66.6 /100 | #159 | Good 38.5% |
| Vietnamese | 66.6 /100 | #160 | Good 38.5% |
| Uruguayans | 65.8 /100 | #161 | Good 38.4% |
| Colombians | 65.0 /100 | #162 | Good 38.4% |
| Peruvians | 63.4 /100 | #163 | Good 38.3% |
| Hungarians | 62.1 /100 | #164 | Good 38.3% |
| Sri Lankans | 59.1 /100 | #165 | Average 38.2% |
| Somalis | 58.6 /100 | #166 | Average 38.1% |
| Scottish | 56.6 /100 | #167 | Average 38.1% |
| Danes | 56.2 /100 | #168 | Average 38.1% |
| Ghanaians | 55.3 /100 | #169 | Average 38.0% |
| Czechs | 54.4 /100 | #170 | Average 38.0% |
| Bermudans | 54.2 /100 | #171 | Average 38.0% |
| Immigrants | Somalia | 52.8 /100 | #172 | Average 37.9% |