Delaware vs Sri Lankan Bachelor's Degree
COMPARE
Delaware
Sri Lankan
Bachelor's Degree
Bachelor's Degree Comparison
Delaware
Sri Lankans
33.8%
BACHELOR'S DEGREE
1.2/ 100
METRIC RATING
244th/ 347
METRIC RANK
38.2%
BACHELOR'S DEGREE
59.1/ 100
METRIC RATING
165th/ 347
METRIC RANK
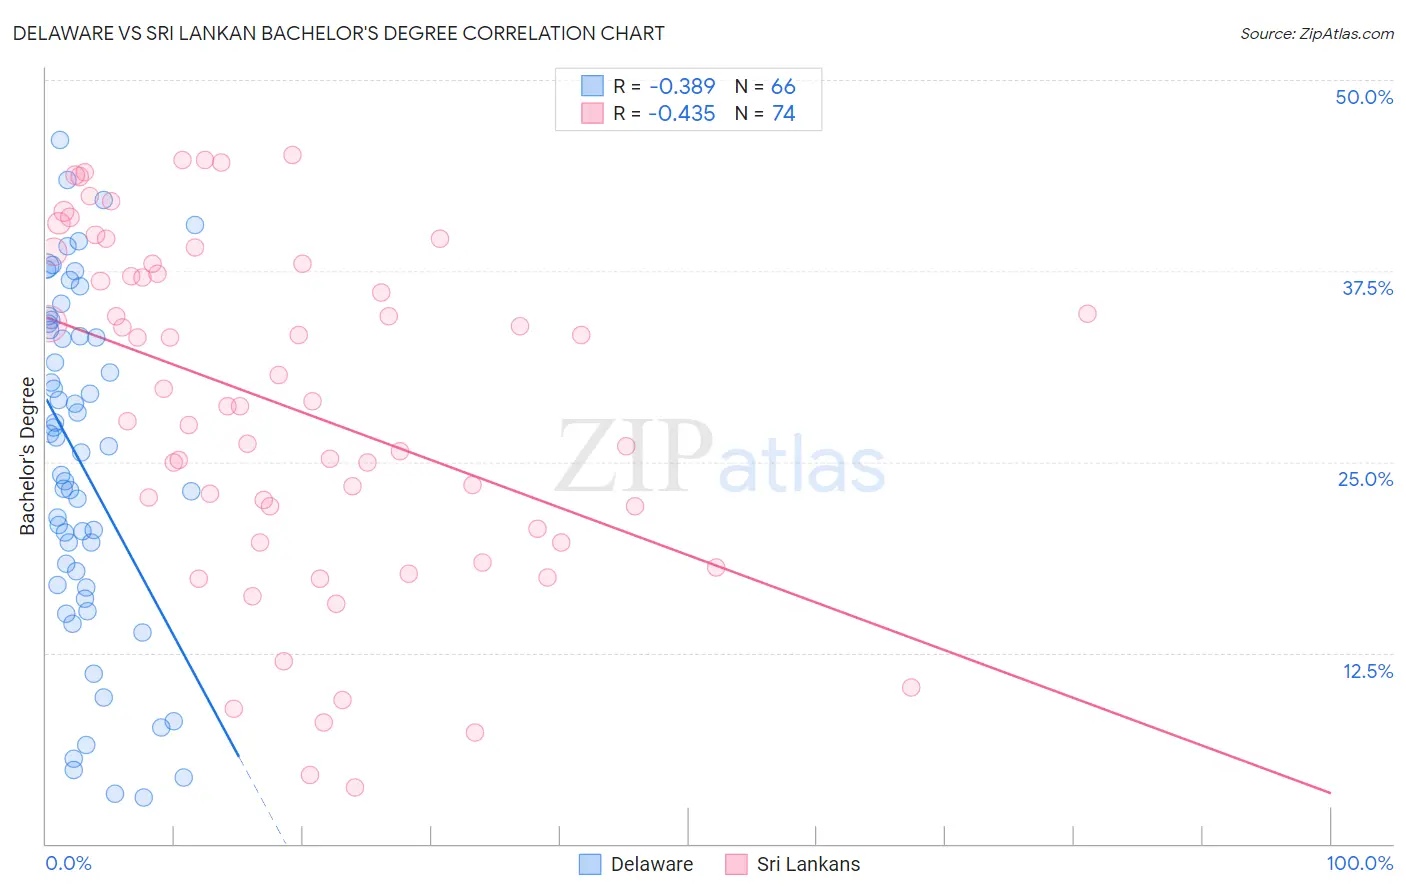
Delaware vs Sri Lankan Bachelor's Degree Correlation Chart
The statistical analysis conducted on geographies consisting of 96,234,889 people shows a mild negative correlation between the proportion of Delaware and percentage of population with at least bachelor's degree education in the United States with a correlation coefficient (R) of -0.389 and weighted average of 33.8%. Similarly, the statistical analysis conducted on geographies consisting of 440,520,330 people shows a moderate negative correlation between the proportion of Sri Lankans and percentage of population with at least bachelor's degree education in the United States with a correlation coefficient (R) of -0.435 and weighted average of 38.2%, a difference of 13.0%.
Bachelor's Degree Correlation Summary
| Measurement | Delaware | Sri Lankan |
| Minimum | 3.0% | 3.7% |
| Maximum | 46.1% | 45.1% |
| Range | 43.0% | 41.4% |
| Mean | 24.8% | 28.6% |
| Median | 25.8% | 28.8% |
| Interquartile 25% (IQ1) | 16.9% | 20.6% |
| Interquartile 75% (IQ3) | 33.6% | 37.9% |
| Interquartile Range (IQR) | 16.7% | 17.3% |
| Standard Deviation (Sample) | 11.0% | 11.1% |
| Standard Deviation (Population) | 11.0% | 11.0% |
Similar Demographics by Bachelor's Degree
Demographics Similar to Delaware by Bachelor's Degree
In terms of bachelor's degree, the demographic groups most similar to Delaware are Immigrants from Fiji (33.7%, a difference of 0.090%), Jamaican (33.6%, a difference of 0.45%), Immigrants from Guyana (33.9%, a difference of 0.50%), Immigrants from Congo (33.6%, a difference of 0.54%), and Cree (33.6%, a difference of 0.56%).
| Demographics | Rating | Rank | Bachelor's Degree |
| Tlingit-Haida | 2.8 /100 | #237 | Tragic 34.6% |
| Guyanese | 2.5 /100 | #238 | Tragic 34.5% |
| British West Indians | 2.5 /100 | #239 | Tragic 34.5% |
| Tongans | 2.0 /100 | #240 | Tragic 34.3% |
| Immigrants | Cambodia | 1.9 /100 | #241 | Tragic 34.2% |
| Immigrants | Nonimmigrants | 1.8 /100 | #242 | Tragic 34.2% |
| Immigrants | Guyana | 1.4 /100 | #243 | Tragic 33.9% |
| Delaware | 1.2 /100 | #244 | Tragic 33.8% |
| Immigrants | Fiji | 1.2 /100 | #245 | Tragic 33.7% |
| Jamaicans | 1.0 /100 | #246 | Tragic 33.6% |
| Immigrants | Congo | 1.0 /100 | #247 | Tragic 33.6% |
| Cree | 1.0 /100 | #248 | Tragic 33.6% |
| Immigrants | Liberia | 0.9 /100 | #249 | Tragic 33.5% |
| Indonesians | 0.9 /100 | #250 | Tragic 33.5% |
| Japanese | 0.7 /100 | #251 | Tragic 33.3% |
Demographics Similar to Sri Lankans by Bachelor's Degree
In terms of bachelor's degree, the demographic groups most similar to Sri Lankans are Somali (38.1%, a difference of 0.050%), Scottish (38.1%, a difference of 0.25%), Danish (38.1%, a difference of 0.29%), Hungarian (38.3%, a difference of 0.30%), and Ghanaian (38.0%, a difference of 0.37%).
| Demographics | Rating | Rank | Bachelor's Degree |
| Immigrants | Germany | 69.6 /100 | #158 | Good 38.6% |
| Chinese | 66.6 /100 | #159 | Good 38.5% |
| Vietnamese | 66.6 /100 | #160 | Good 38.5% |
| Uruguayans | 65.8 /100 | #161 | Good 38.4% |
| Colombians | 65.0 /100 | #162 | Good 38.4% |
| Peruvians | 63.4 /100 | #163 | Good 38.3% |
| Hungarians | 62.1 /100 | #164 | Good 38.3% |
| Sri Lankans | 59.1 /100 | #165 | Average 38.2% |
| Somalis | 58.6 /100 | #166 | Average 38.1% |
| Scottish | 56.6 /100 | #167 | Average 38.1% |
| Danes | 56.2 /100 | #168 | Average 38.1% |
| Ghanaians | 55.3 /100 | #169 | Average 38.0% |
| Czechs | 54.4 /100 | #170 | Average 38.0% |
| Bermudans | 54.2 /100 | #171 | Average 38.0% |
| Immigrants | Somalia | 52.8 /100 | #172 | Average 37.9% |