Alaska Native vs Liberian Bachelor's Degree
COMPARE
Alaska Native
Liberian
Bachelor's Degree
Bachelor's Degree Comparison
Alaska Natives
Liberians
29.4%
BACHELOR'S DEGREE
0.0/ 100
METRIC RATING
313th/ 347
METRIC RANK
34.6%
BACHELOR'S DEGREE
2.8/ 100
METRIC RATING
236th/ 347
METRIC RANK
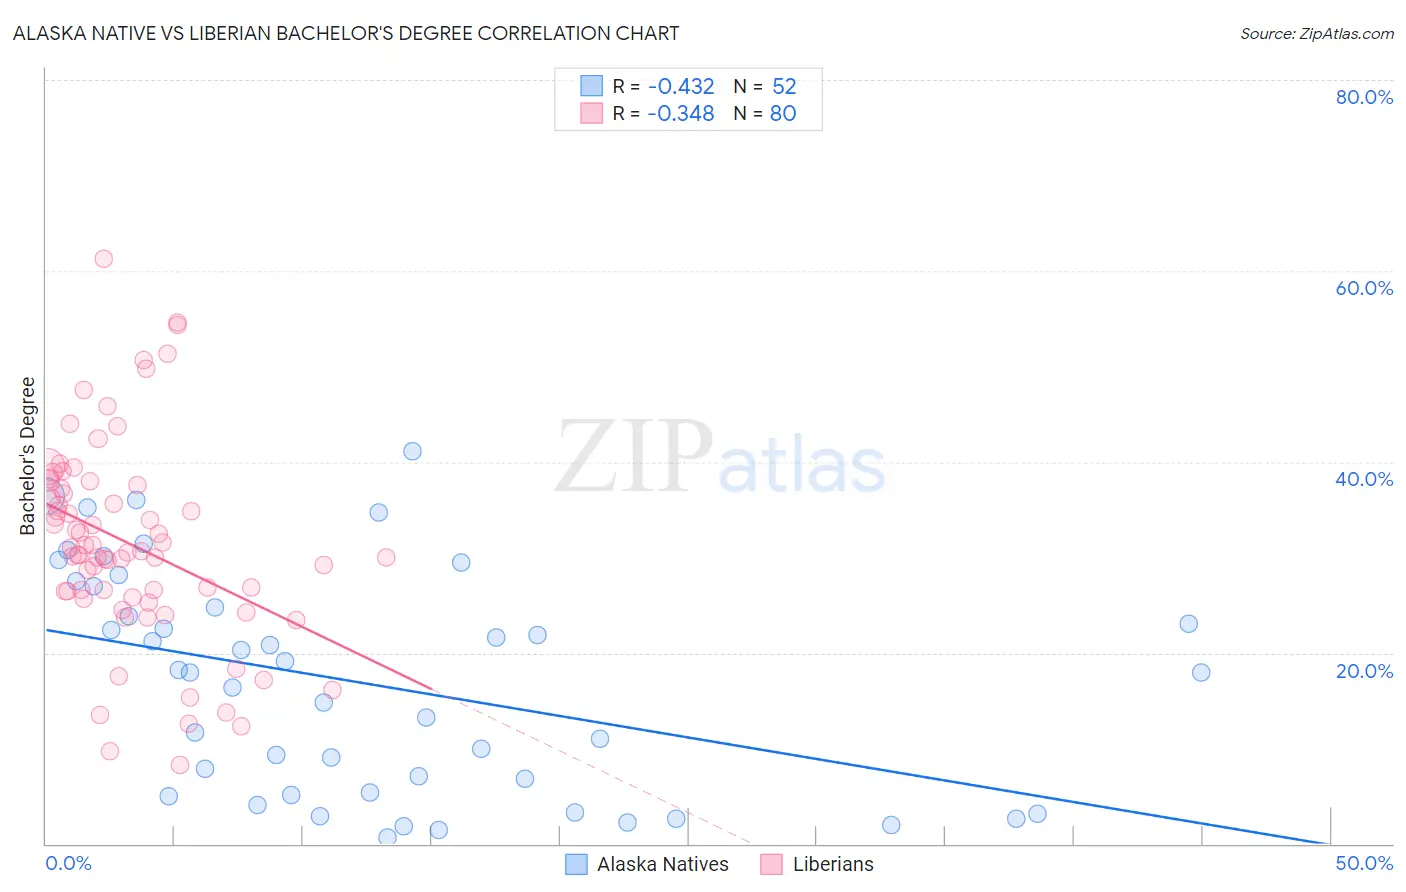
Alaska Native vs Liberian Bachelor's Degree Correlation Chart
The statistical analysis conducted on geographies consisting of 76,776,170 people shows a moderate negative correlation between the proportion of Alaska Natives and percentage of population with at least bachelor's degree education in the United States with a correlation coefficient (R) of -0.432 and weighted average of 29.4%. Similarly, the statistical analysis conducted on geographies consisting of 118,099,075 people shows a mild negative correlation between the proportion of Liberians and percentage of population with at least bachelor's degree education in the United States with a correlation coefficient (R) of -0.348 and weighted average of 34.6%, a difference of 17.8%.
Bachelor's Degree Correlation Summary
| Measurement | Alaska Native | Liberian |
| Minimum | 0.66% | 8.2% |
| Maximum | 41.1% | 61.3% |
| Range | 40.4% | 53.0% |
| Mean | 16.8% | 31.5% |
| Median | 17.9% | 30.6% |
| Interquartile 25% (IQ1) | 5.2% | 26.1% |
| Interquartile 75% (IQ3) | 25.9% | 37.3% |
| Interquartile Range (IQR) | 20.6% | 11.2% |
| Standard Deviation (Sample) | 11.5% | 10.5% |
| Standard Deviation (Population) | 11.4% | 10.4% |
Similar Demographics by Bachelor's Degree
Demographics Similar to Alaska Natives by Bachelor's Degree
In terms of bachelor's degree, the demographic groups most similar to Alaska Natives are Seminole (29.4%, a difference of 0.18%), Choctaw (29.4%, a difference of 0.24%), Shoshone (29.3%, a difference of 0.29%), Cheyenne (29.4%, a difference of 0.31%), and Immigrants from Cabo Verde (29.2%, a difference of 0.37%).
| Demographics | Rating | Rank | Bachelor's Degree |
| Immigrants | Yemen | 0.0 /100 | #306 | Tragic 29.9% |
| Nepalese | 0.0 /100 | #307 | Tragic 29.9% |
| Cajuns | 0.0 /100 | #308 | Tragic 29.6% |
| Hispanics or Latinos | 0.0 /100 | #309 | Tragic 29.6% |
| Cheyenne | 0.0 /100 | #310 | Tragic 29.4% |
| Choctaw | 0.0 /100 | #311 | Tragic 29.4% |
| Seminole | 0.0 /100 | #312 | Tragic 29.4% |
| Alaska Natives | 0.0 /100 | #313 | Tragic 29.4% |
| Shoshone | 0.0 /100 | #314 | Tragic 29.3% |
| Immigrants | Cabo Verde | 0.0 /100 | #315 | Tragic 29.2% |
| Sioux | 0.0 /100 | #316 | Tragic 29.1% |
| Colville | 0.0 /100 | #317 | Tragic 29.0% |
| Yaqui | 0.0 /100 | #318 | Tragic 29.0% |
| Creek | 0.0 /100 | #319 | Tragic 28.9% |
| Kiowa | 0.0 /100 | #320 | Tragic 28.8% |
Demographics Similar to Liberians by Bachelor's Degree
In terms of bachelor's degree, the demographic groups most similar to Liberians are Tlingit-Haida (34.6%, a difference of 0.040%), Immigrants from West Indies (34.6%, a difference of 0.11%), Guamanian/Chamorro (34.6%, a difference of 0.20%), Guyanese (34.5%, a difference of 0.32%), and British West Indian (34.5%, a difference of 0.34%).
| Demographics | Rating | Rank | Bachelor's Degree |
| Whites/Caucasians | 5.9 /100 | #229 | Tragic 35.3% |
| Immigrants | Grenada | 4.3 /100 | #230 | Tragic 35.0% |
| Immigrants | St. Vincent and the Grenadines | 4.3 /100 | #231 | Tragic 35.0% |
| Hmong | 3.4 /100 | #232 | Tragic 34.8% |
| Immigrants | Ecuador | 3.3 /100 | #233 | Tragic 34.7% |
| Guamanians/Chamorros | 3.0 /100 | #234 | Tragic 34.6% |
| Immigrants | West Indies | 2.9 /100 | #235 | Tragic 34.6% |
| Liberians | 2.8 /100 | #236 | Tragic 34.6% |
| Tlingit-Haida | 2.8 /100 | #237 | Tragic 34.6% |
| Guyanese | 2.5 /100 | #238 | Tragic 34.5% |
| British West Indians | 2.5 /100 | #239 | Tragic 34.5% |
| Tongans | 2.0 /100 | #240 | Tragic 34.3% |
| Immigrants | Cambodia | 1.9 /100 | #241 | Tragic 34.2% |
| Immigrants | Nonimmigrants | 1.8 /100 | #242 | Tragic 34.2% |
| Immigrants | Guyana | 1.4 /100 | #243 | Tragic 33.9% |