Samoan vs Immigrants from North America 6th Grade
COMPARE
Samoan
Immigrants from North America
6th Grade
6th Grade Comparison
Samoans
Immigrants from North America
96.8%
6TH GRADE
11.0/ 100
METRIC RATING
208th/ 347
METRIC RANK
97.7%
6TH GRADE
99.7/ 100
METRIC RATING
62nd/ 347
METRIC RANK
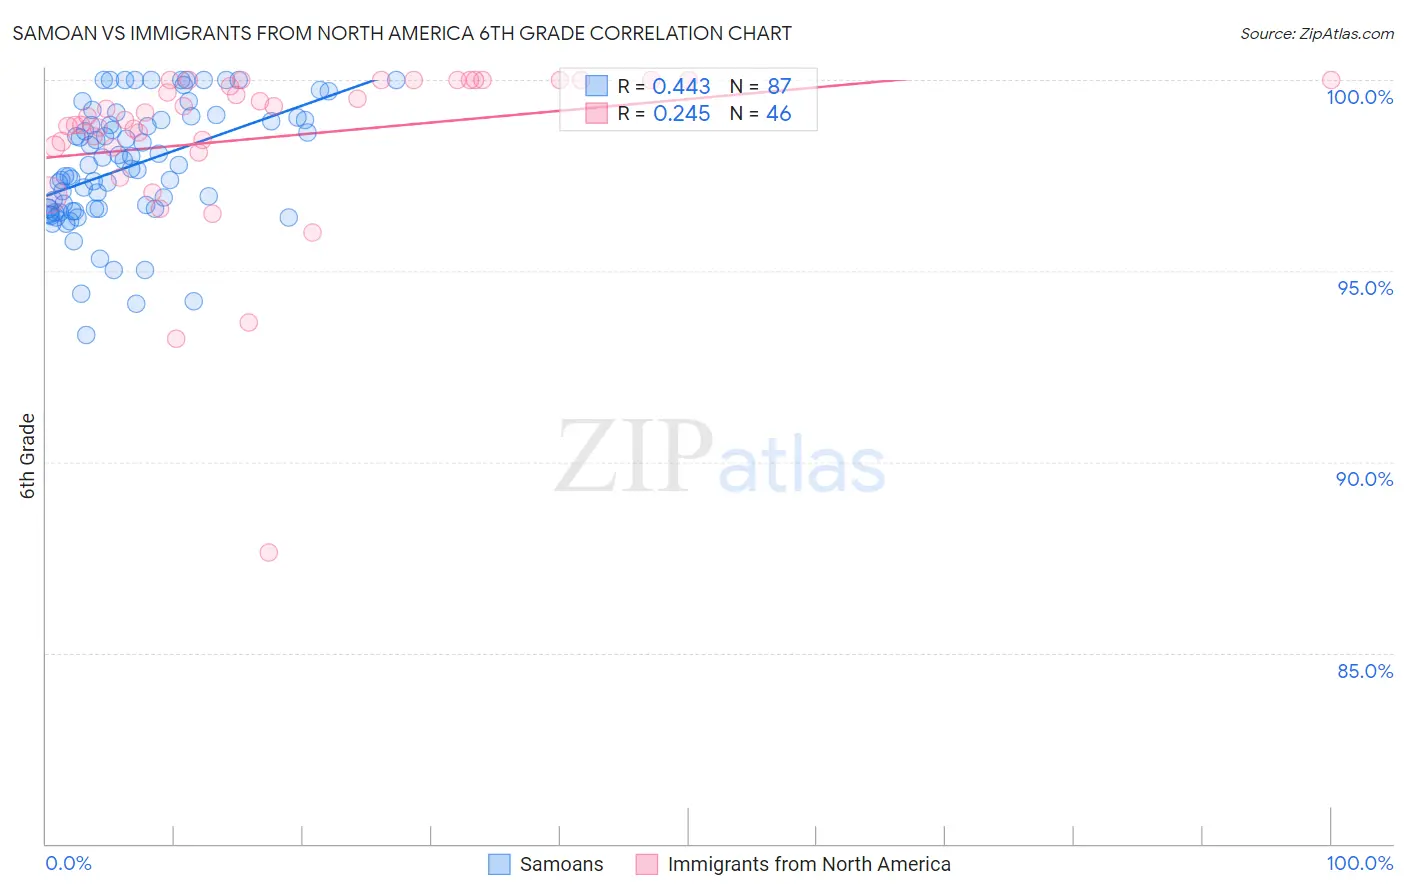
Samoan vs Immigrants from North America 6th Grade Correlation Chart
The statistical analysis conducted on geographies consisting of 225,201,909 people shows a moderate positive correlation between the proportion of Samoans and percentage of population with at least 6th grade education in the United States with a correlation coefficient (R) of 0.443 and weighted average of 96.8%. Similarly, the statistical analysis conducted on geographies consisting of 462,462,330 people shows a weak positive correlation between the proportion of Immigrants from North America and percentage of population with at least 6th grade education in the United States with a correlation coefficient (R) of 0.245 and weighted average of 97.7%, a difference of 0.92%.
6th Grade Correlation Summary
| Measurement | Samoan | Immigrants from North America |
| Minimum | 93.3% | 87.6% |
| Maximum | 100.0% | 100.0% |
| Range | 6.7% | 12.4% |
| Mean | 97.8% | 98.5% |
| Median | 97.8% | 99.1% |
| Interquartile 25% (IQ1) | 96.6% | 98.3% |
| Interquartile 75% (IQ3) | 99.0% | 100.0% |
| Interquartile Range (IQR) | 2.4% | 1.7% |
| Standard Deviation (Sample) | 1.6% | 2.3% |
| Standard Deviation (Population) | 1.6% | 2.2% |
Similar Demographics by 6th Grade
Demographics Similar to Samoans by 6th Grade
In terms of 6th grade, the demographic groups most similar to Samoans are Immigrants from Oceania (96.8%, a difference of 0.0%), Laotian (96.8%, a difference of 0.010%), Iraqi (96.8%, a difference of 0.010%), Immigrants from Nepal (96.8%, a difference of 0.010%), and Native/Alaskan (96.8%, a difference of 0.020%).
| Demographics | Rating | Rank | 6th Grade |
| Immigrants | Zaire | 14.5 /100 | #201 | Poor 96.9% |
| Immigrants | Chile | 14.2 /100 | #202 | Poor 96.8% |
| Sudanese | 13.9 /100 | #203 | Poor 96.8% |
| Immigrants | Bahamas | 13.8 /100 | #204 | Poor 96.8% |
| Natives/Alaskans | 13.0 /100 | #205 | Poor 96.8% |
| Laotians | 11.8 /100 | #206 | Poor 96.8% |
| Iraqis | 11.7 /100 | #207 | Poor 96.8% |
| Samoans | 11.0 /100 | #208 | Poor 96.8% |
| Immigrants | Oceania | 11.0 /100 | #209 | Poor 96.8% |
| Immigrants | Nepal | 10.1 /100 | #210 | Poor 96.8% |
| Immigrants | Iraq | 9.2 /100 | #211 | Tragic 96.8% |
| Moroccans | 9.0 /100 | #212 | Tragic 96.8% |
| Immigrants | Sudan | 8.7 /100 | #213 | Tragic 96.8% |
| Portuguese | 8.2 /100 | #214 | Tragic 96.8% |
| Sierra Leoneans | 8.0 /100 | #215 | Tragic 96.8% |
Demographics Similar to Immigrants from North America by 6th Grade
In terms of 6th grade, the demographic groups most similar to Immigrants from North America are Immigrants from Canada (97.7%, a difference of 0.010%), Serbian (97.7%, a difference of 0.010%), Russian (97.7%, a difference of 0.010%), Greek (97.7%, a difference of 0.020%), and American (97.7%, a difference of 0.020%).
| Demographics | Rating | Rank | 6th Grade |
| Aleuts | 99.8 /100 | #55 | Exceptional 97.7% |
| Austrians | 99.8 /100 | #56 | Exceptional 97.7% |
| Whites/Caucasians | 99.8 /100 | #57 | Exceptional 97.7% |
| Greeks | 99.8 /100 | #58 | Exceptional 97.7% |
| Americans | 99.8 /100 | #59 | Exceptional 97.7% |
| Immigrants | Canada | 99.8 /100 | #60 | Exceptional 97.7% |
| Serbians | 99.7 /100 | #61 | Exceptional 97.7% |
| Immigrants | North America | 99.7 /100 | #62 | Exceptional 97.7% |
| Russians | 99.7 /100 | #63 | Exceptional 97.7% |
| Canadians | 99.7 /100 | #64 | Exceptional 97.7% |
| Immigrants | Northern Europe | 99.6 /100 | #65 | Exceptional 97.7% |
| New Zealanders | 99.6 /100 | #66 | Exceptional 97.7% |
| Kiowa | 99.6 /100 | #67 | Exceptional 97.7% |
| Immigrants | Austria | 99.6 /100 | #68 | Exceptional 97.7% |
| Iranians | 99.6 /100 | #69 | Exceptional 97.6% |