Iraqi vs Immigrants from North America Bachelor's Degree
COMPARE
Iraqi
Immigrants from North America
Bachelor's Degree
Bachelor's Degree Comparison
Iraqis
Immigrants from North America
39.0%
BACHELOR'S DEGREE
78.1/ 100
METRIC RATING
148th/ 347
METRIC RANK
41.7%
BACHELOR'S DEGREE
98.5/ 100
METRIC RATING
95th/ 347
METRIC RANK
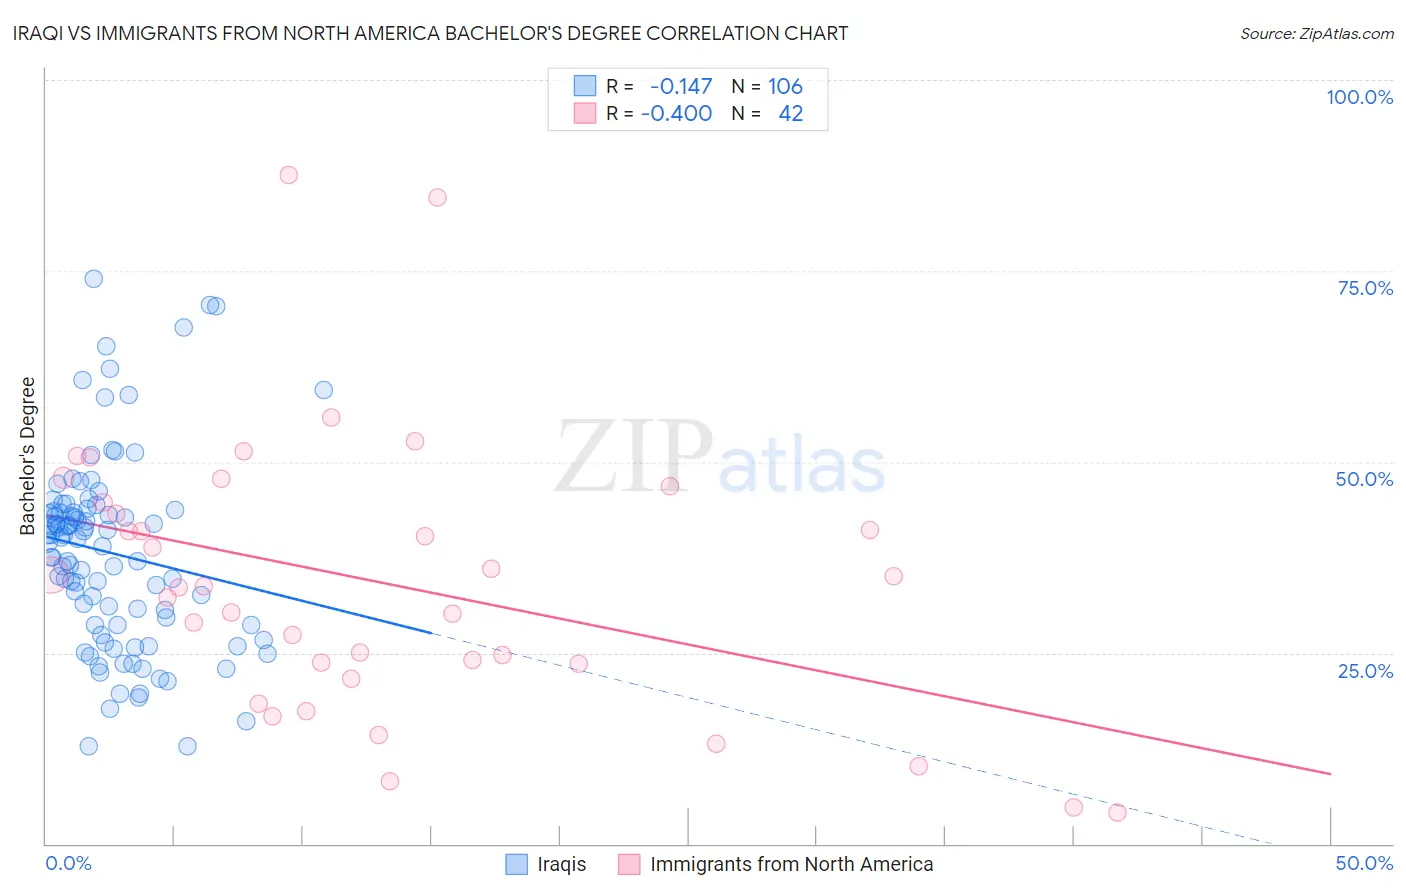
Iraqi vs Immigrants from North America Bachelor's Degree Correlation Chart
The statistical analysis conducted on geographies consisting of 170,654,288 people shows a poor negative correlation between the proportion of Iraqis and percentage of population with at least bachelor's degree education in the United States with a correlation coefficient (R) of -0.147 and weighted average of 39.0%. Similarly, the statistical analysis conducted on geographies consisting of 462,429,202 people shows a mild negative correlation between the proportion of Immigrants from North America and percentage of population with at least bachelor's degree education in the United States with a correlation coefficient (R) of -0.400 and weighted average of 41.7%, a difference of 6.8%.
Bachelor's Degree Correlation Summary
| Measurement | Iraqi | Immigrants from North America |
| Minimum | 12.8% | 4.2% |
| Maximum | 74.1% | 87.6% |
| Range | 61.3% | 83.5% |
| Mean | 38.1% | 34.2% |
| Median | 39.7% | 33.6% |
| Interquartile 25% (IQ1) | 28.6% | 23.5% |
| Interquartile 75% (IQ3) | 43.6% | 44.7% |
| Interquartile Range (IQR) | 15.0% | 21.2% |
| Standard Deviation (Sample) | 12.6% | 18.1% |
| Standard Deviation (Population) | 12.5% | 17.9% |
Similar Demographics by Bachelor's Degree
Demographics Similar to Iraqis by Bachelor's Degree
In terms of bachelor's degree, the demographic groups most similar to Iraqis are Immigrants from Poland (39.0%, a difference of 0.080%), South American (38.9%, a difference of 0.11%), Immigrants from Sierra Leone (39.0%, a difference of 0.14%), Swedish (39.1%, a difference of 0.17%), and Slovene (39.1%, a difference of 0.21%).
| Demographics | Rating | Rank | Bachelor's Degree |
| South American Indians | 83.6 /100 | #141 | Excellent 39.3% |
| Immigrants | North Macedonia | 81.6 /100 | #142 | Excellent 39.2% |
| Poles | 79.8 /100 | #143 | Good 39.1% |
| Immigrants | Afghanistan | 79.7 /100 | #144 | Good 39.1% |
| Slovenes | 79.5 /100 | #145 | Good 39.1% |
| Swedes | 79.2 /100 | #146 | Good 39.1% |
| Immigrants | Sierra Leone | 79.0 /100 | #147 | Good 39.0% |
| Iraqis | 78.1 /100 | #148 | Good 39.0% |
| Immigrants | Poland | 77.5 /100 | #149 | Good 39.0% |
| South Americans | 77.3 /100 | #150 | Good 38.9% |
| Immigrants | Africa | 76.5 /100 | #151 | Good 38.9% |
| Sudanese | 76.4 /100 | #152 | Good 38.9% |
| Slavs | 75.9 /100 | #153 | Good 38.9% |
| Canadians | 75.0 /100 | #154 | Good 38.8% |
| Immigrants | Kenya | 73.8 /100 | #155 | Good 38.8% |
Demographics Similar to Immigrants from North America by Bachelor's Degree
In terms of bachelor's degree, the demographic groups most similar to Immigrants from North America are Immigrants from Moldova (41.6%, a difference of 0.11%), Immigrants from Nepal (41.7%, a difference of 0.12%), Immigrants from Canada (41.7%, a difference of 0.15%), Romanian (41.6%, a difference of 0.16%), and Immigrants from Ukraine (41.5%, a difference of 0.27%).
| Demographics | Rating | Rank | Bachelor's Degree |
| Immigrants | Western Europe | 99.0 /100 | #88 | Exceptional 42.0% |
| Greeks | 99.0 /100 | #89 | Exceptional 42.0% |
| Laotians | 98.9 /100 | #90 | Exceptional 42.0% |
| Immigrants | Northern Africa | 98.9 /100 | #91 | Exceptional 41.9% |
| Maltese | 98.8 /100 | #92 | Exceptional 41.9% |
| Immigrants | Canada | 98.6 /100 | #93 | Exceptional 41.7% |
| Immigrants | Nepal | 98.6 /100 | #94 | Exceptional 41.7% |
| Immigrants | North America | 98.5 /100 | #95 | Exceptional 41.7% |
| Immigrants | Moldova | 98.4 /100 | #96 | Exceptional 41.6% |
| Romanians | 98.4 /100 | #97 | Exceptional 41.6% |
| Immigrants | Ukraine | 98.3 /100 | #98 | Exceptional 41.5% |
| Immigrants | England | 98.1 /100 | #99 | Exceptional 41.4% |
| Macedonians | 98.1 /100 | #100 | Exceptional 41.4% |
| Immigrants | Morocco | 98.0 /100 | #101 | Exceptional 41.4% |
| Immigrants | Italy | 97.8 /100 | #102 | Exceptional 41.3% |