Samoan vs Immigrants from Cameroon 9th Grade
COMPARE
Samoan
Immigrants from Cameroon
9th Grade
9th Grade Comparison
Samoans
Immigrants from Cameroon
94.6%
9TH GRADE
17.3/ 100
METRIC RATING
206th/ 347
METRIC RANK
94.2%
9TH GRADE
2.1/ 100
METRIC RATING
243rd/ 347
METRIC RANK
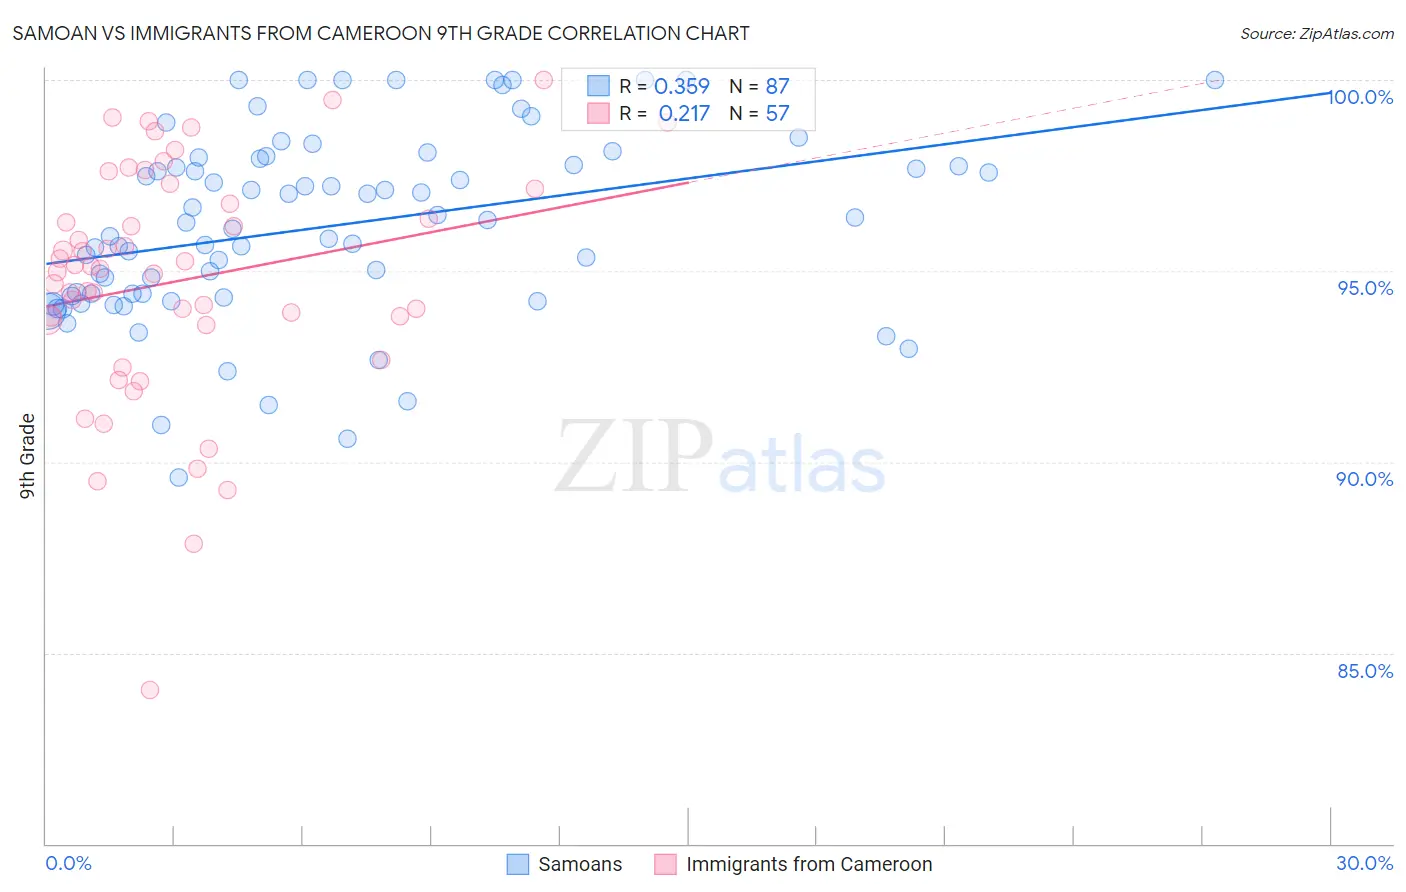
Samoan vs Immigrants from Cameroon 9th Grade Correlation Chart
The statistical analysis conducted on geographies consisting of 225,201,909 people shows a mild positive correlation between the proportion of Samoans and percentage of population with at least 9th grade education in the United States with a correlation coefficient (R) of 0.359 and weighted average of 94.6%. Similarly, the statistical analysis conducted on geographies consisting of 130,618,704 people shows a weak positive correlation between the proportion of Immigrants from Cameroon and percentage of population with at least 9th grade education in the United States with a correlation coefficient (R) of 0.217 and weighted average of 94.2%, a difference of 0.42%.
9th Grade Correlation Summary
| Measurement | Samoan | Immigrants from Cameroon |
| Minimum | 89.6% | 84.0% |
| Maximum | 100.0% | 100.0% |
| Range | 10.4% | 16.0% |
| Mean | 96.2% | 94.7% |
| Median | 96.3% | 95.1% |
| Interquartile 25% (IQ1) | 94.3% | 93.7% |
| Interquartile 75% (IQ3) | 97.9% | 97.0% |
| Interquartile Range (IQR) | 3.6% | 3.3% |
| Standard Deviation (Sample) | 2.4% | 3.1% |
| Standard Deviation (Population) | 2.4% | 3.1% |
Similar Demographics by 9th Grade
Demographics Similar to Samoans by 9th Grade
In terms of 9th grade, the demographic groups most similar to Samoans are Immigrants from Sudan (94.6%, a difference of 0.0%), Immigrants from Morocco (94.6%, a difference of 0.010%), Immigrants from Pakistan (94.6%, a difference of 0.020%), Immigrants from Eastern Asia (94.6%, a difference of 0.030%), and Immigrants from Bahamas (94.6%, a difference of 0.030%).
| Demographics | Rating | Rank | 9th Grade |
| Laotians | 21.0 /100 | #199 | Fair 94.6% |
| Immigrants | Zaire | 20.6 /100 | #200 | Fair 94.6% |
| Blacks/African Americans | 20.5 /100 | #201 | Fair 94.6% |
| Immigrants | Eastern Asia | 19.8 /100 | #202 | Poor 94.6% |
| Immigrants | Bahamas | 19.8 /100 | #203 | Poor 94.6% |
| Moroccans | 19.6 /100 | #204 | Poor 94.6% |
| Immigrants | Sudan | 17.6 /100 | #205 | Poor 94.6% |
| Samoans | 17.3 /100 | #206 | Poor 94.6% |
| Immigrants | Morocco | 16.3 /100 | #207 | Poor 94.6% |
| Immigrants | Pakistan | 15.5 /100 | #208 | Poor 94.6% |
| Comanche | 14.9 /100 | #209 | Poor 94.6% |
| Immigrants | Chile | 13.4 /100 | #210 | Poor 94.5% |
| Immigrants | Indonesia | 12.3 /100 | #211 | Poor 94.5% |
| Immigrants | Malaysia | 12.2 /100 | #212 | Poor 94.5% |
| Immigrants | Oceania | 12.1 /100 | #213 | Poor 94.5% |
Demographics Similar to Immigrants from Cameroon by 9th Grade
In terms of 9th grade, the demographic groups most similar to Immigrants from Cameroon are Immigrants from Middle Africa (94.2%, a difference of 0.0%), Dutch West Indian (94.2%, a difference of 0.010%), Paiute (94.2%, a difference of 0.020%), Senegalese (94.2%, a difference of 0.020%), and Afghan (94.2%, a difference of 0.030%).
| Demographics | Rating | Rank | 9th Grade |
| Somalis | 2.9 /100 | #236 | Tragic 94.3% |
| Koreans | 2.9 /100 | #237 | Tragic 94.3% |
| South American Indians | 2.8 /100 | #238 | Tragic 94.3% |
| Immigrants | China | 2.8 /100 | #239 | Tragic 94.3% |
| Immigrants | Ethiopia | 2.7 /100 | #240 | Tragic 94.3% |
| Spanish Americans | 2.6 /100 | #241 | Tragic 94.2% |
| Immigrants | Middle Africa | 2.2 /100 | #242 | Tragic 94.2% |
| Immigrants | Cameroon | 2.1 /100 | #243 | Tragic 94.2% |
| Dutch West Indians | 2.0 /100 | #244 | Tragic 94.2% |
| Paiute | 1.9 /100 | #245 | Tragic 94.2% |
| Senegalese | 1.9 /100 | #246 | Tragic 94.2% |
| Afghans | 1.8 /100 | #247 | Tragic 94.2% |
| Immigrants | Somalia | 1.4 /100 | #248 | Tragic 94.1% |
| Uruguayans | 1.3 /100 | #249 | Tragic 94.1% |
| Immigrants | Hong Kong | 1.3 /100 | #250 | Tragic 94.1% |