Luxembourger vs Immigrants from Brazil Associate's Degree
COMPARE
Luxembourger
Immigrants from Brazil
Associate's Degree
Associate's Degree Comparison
Luxembourgers
Immigrants from Brazil
48.9%
ASSOCIATE'S DEGREE
95.1/ 100
METRIC RATING
115th/ 347
METRIC RANK
50.0%
ASSOCIATE'S DEGREE
98.5/ 100
METRIC RATING
93rd/ 347
METRIC RANK
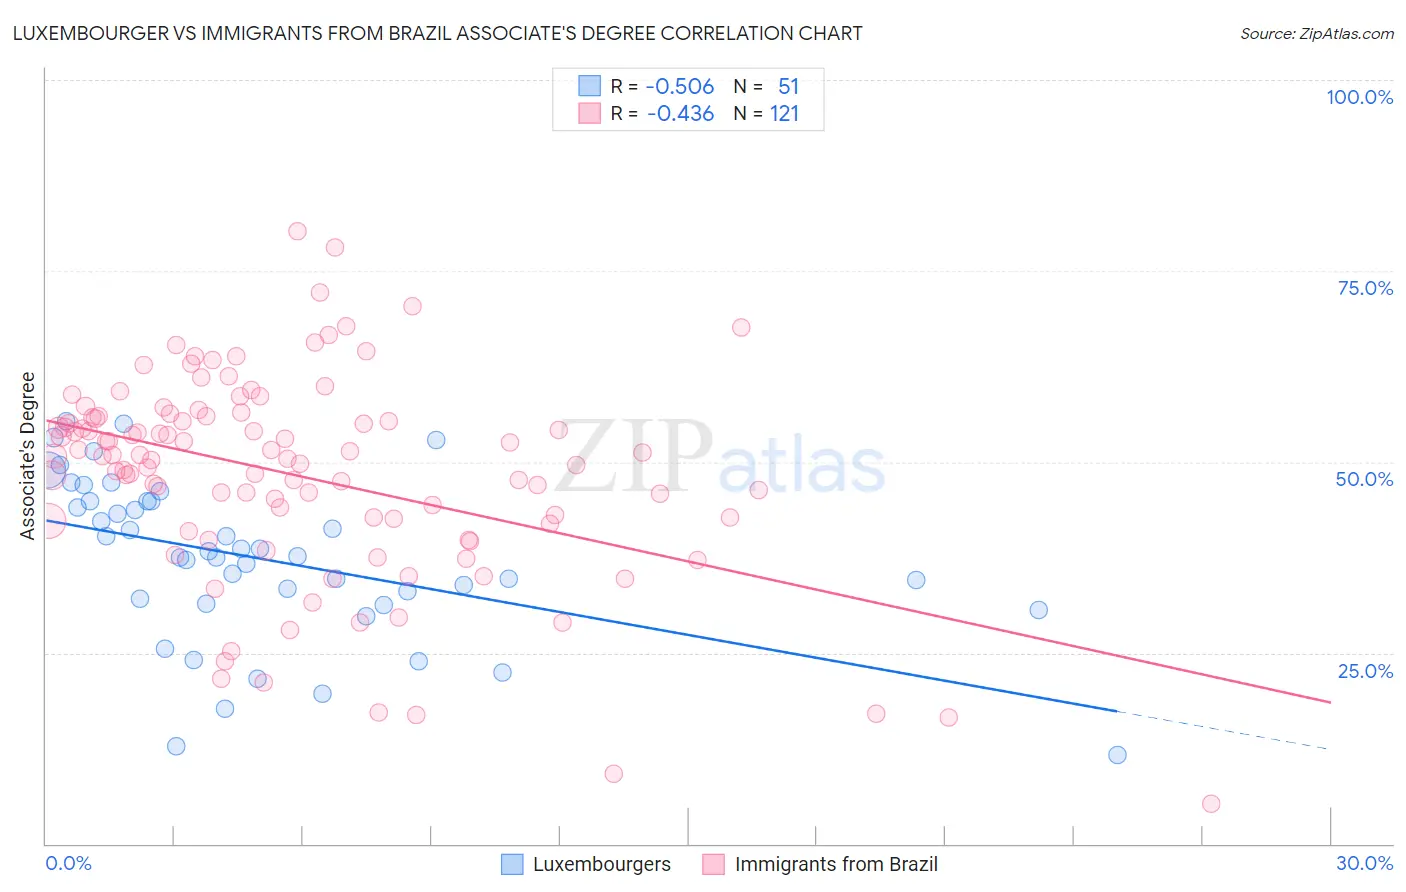
Luxembourger vs Immigrants from Brazil Associate's Degree Correlation Chart
The statistical analysis conducted on geographies consisting of 144,669,257 people shows a substantial negative correlation between the proportion of Luxembourgers and percentage of population with at least associate's degree education in the United States with a correlation coefficient (R) of -0.506 and weighted average of 48.9%. Similarly, the statistical analysis conducted on geographies consisting of 343,003,765 people shows a moderate negative correlation between the proportion of Immigrants from Brazil and percentage of population with at least associate's degree education in the United States with a correlation coefficient (R) of -0.436 and weighted average of 50.0%, a difference of 2.2%.
Associate's Degree Correlation Summary
| Measurement | Luxembourger | Immigrants from Brazil |
| Minimum | 11.7% | 5.3% |
| Maximum | 55.4% | 80.2% |
| Range | 43.7% | 75.0% |
| Mean | 37.3% | 48.1% |
| Median | 37.6% | 50.7% |
| Interquartile 25% (IQ1) | 31.5% | 42.1% |
| Interquartile 75% (IQ3) | 44.8% | 55.9% |
| Interquartile Range (IQR) | 13.3% | 13.7% |
| Standard Deviation (Sample) | 10.5% | 13.6% |
| Standard Deviation (Population) | 10.4% | 13.5% |
Similar Demographics by Associate's Degree
Demographics Similar to Luxembourgers by Associate's Degree
In terms of associate's degree, the demographic groups most similar to Luxembourgers are Immigrants from Chile (49.0%, a difference of 0.070%), Palestinian (49.0%, a difference of 0.070%), Arab (49.0%, a difference of 0.070%), British (48.9%, a difference of 0.070%), and Afghan (48.9%, a difference of 0.11%).
| Demographics | Rating | Rank | Associate's Degree |
| Jordanians | 96.6 /100 | #108 | Exceptional 49.2% |
| Immigrants | Morocco | 96.3 /100 | #109 | Exceptional 49.2% |
| Austrians | 95.8 /100 | #110 | Exceptional 49.1% |
| Immigrants | Venezuela | 95.8 /100 | #111 | Exceptional 49.1% |
| Immigrants | Chile | 95.3 /100 | #112 | Exceptional 49.0% |
| Palestinians | 95.3 /100 | #113 | Exceptional 49.0% |
| Arabs | 95.3 /100 | #114 | Exceptional 49.0% |
| Luxembourgers | 95.1 /100 | #115 | Exceptional 48.9% |
| British | 95.0 /100 | #116 | Exceptional 48.9% |
| Afghans | 94.8 /100 | #117 | Exceptional 48.9% |
| Albanians | 94.7 /100 | #118 | Exceptional 48.8% |
| Lebanese | 94.6 /100 | #119 | Exceptional 48.8% |
| Alsatians | 94.6 /100 | #120 | Exceptional 48.8% |
| Ugandans | 93.9 /100 | #121 | Exceptional 48.7% |
| Italians | 93.9 /100 | #122 | Exceptional 48.7% |
Demographics Similar to Immigrants from Brazil by Associate's Degree
In terms of associate's degree, the demographic groups most similar to Immigrants from Brazil are Laotian (49.9%, a difference of 0.13%), Immigrants from North America (50.1%, a difference of 0.15%), Immigrants from Western Asia (50.1%, a difference of 0.18%), Immigrants from Ethiopia (50.1%, a difference of 0.25%), and Immigrants from Western Europe (50.1%, a difference of 0.26%).
| Demographics | Rating | Rank | Associate's Degree |
| Immigrants | Croatia | 98.9 /100 | #86 | Exceptional 50.2% |
| Immigrants | Moldova | 98.8 /100 | #87 | Exceptional 50.2% |
| Immigrants | Canada | 98.7 /100 | #88 | Exceptional 50.1% |
| Immigrants | Western Europe | 98.7 /100 | #89 | Exceptional 50.1% |
| Immigrants | Ethiopia | 98.7 /100 | #90 | Exceptional 50.1% |
| Immigrants | Western Asia | 98.7 /100 | #91 | Exceptional 50.1% |
| Immigrants | North America | 98.7 /100 | #92 | Exceptional 50.1% |
| Immigrants | Brazil | 98.5 /100 | #93 | Exceptional 50.0% |
| Laotians | 98.4 /100 | #94 | Exceptional 49.9% |
| Immigrants | England | 98.0 /100 | #95 | Exceptional 49.7% |
| Romanians | 98.0 /100 | #96 | Exceptional 49.7% |
| Immigrants | Ukraine | 98.0 /100 | #97 | Exceptional 49.7% |
| Immigrants | Northern Africa | 97.9 /100 | #98 | Exceptional 49.7% |
| Macedonians | 97.8 /100 | #99 | Exceptional 49.6% |
| Immigrants | Nepal | 97.5 /100 | #100 | Exceptional 49.5% |