Australian vs Immigrants from Brazil Associate's Degree
COMPARE
Australian
Immigrants from Brazil
Associate's Degree
Associate's Degree Comparison
Australians
Immigrants from Brazil
51.9%
ASSOCIATE'S DEGREE
99.8/ 100
METRIC RATING
55th/ 347
METRIC RANK
50.0%
ASSOCIATE'S DEGREE
98.5/ 100
METRIC RATING
93rd/ 347
METRIC RANK
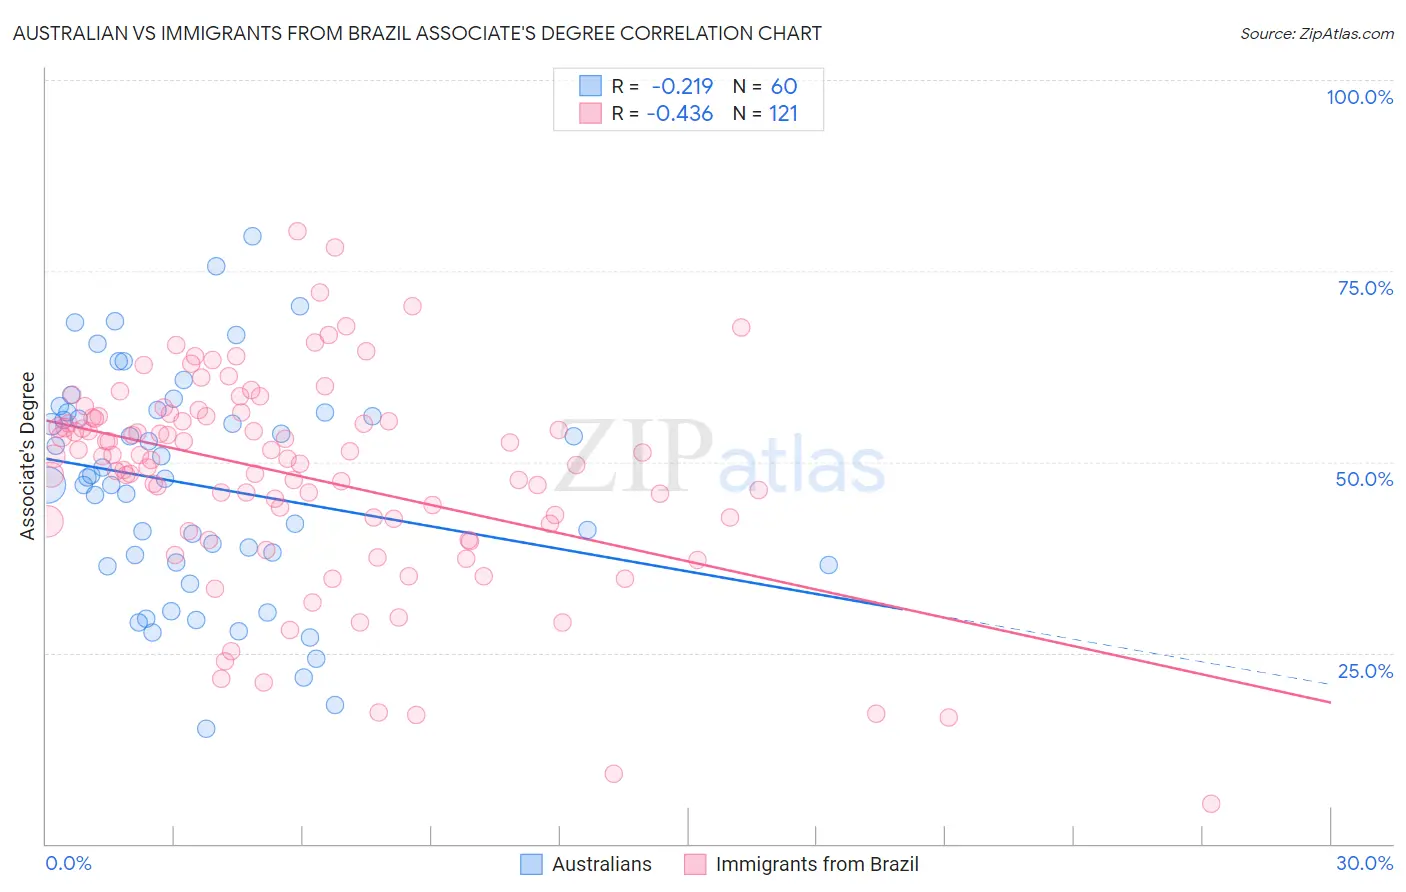
Australian vs Immigrants from Brazil Associate's Degree Correlation Chart
The statistical analysis conducted on geographies consisting of 224,144,542 people shows a weak negative correlation between the proportion of Australians and percentage of population with at least associate's degree education in the United States with a correlation coefficient (R) of -0.219 and weighted average of 51.9%. Similarly, the statistical analysis conducted on geographies consisting of 343,003,765 people shows a moderate negative correlation between the proportion of Immigrants from Brazil and percentage of population with at least associate's degree education in the United States with a correlation coefficient (R) of -0.436 and weighted average of 50.0%, a difference of 3.8%.
Associate's Degree Correlation Summary
| Measurement | Australian | Immigrants from Brazil |
| Minimum | 15.1% | 5.3% |
| Maximum | 79.5% | 80.2% |
| Range | 64.4% | 75.0% |
| Mean | 47.0% | 48.1% |
| Median | 47.9% | 50.7% |
| Interquartile 25% (IQ1) | 36.7% | 42.1% |
| Interquartile 75% (IQ3) | 56.5% | 55.9% |
| Interquartile Range (IQR) | 19.8% | 13.7% |
| Standard Deviation (Sample) | 14.6% | 13.6% |
| Standard Deviation (Population) | 14.4% | 13.5% |
Similar Demographics by Associate's Degree
Demographics Similar to Australians by Associate's Degree
In terms of associate's degree, the demographic groups most similar to Australians are Immigrants from Czechoslovakia (51.9%, a difference of 0.020%), Immigrants from Spain (51.9%, a difference of 0.030%), Immigrants from Asia (52.0%, a difference of 0.13%), Paraguayan (51.8%, a difference of 0.14%), and Bolivian (52.0%, a difference of 0.16%).
| Demographics | Rating | Rank | Associate's Degree |
| Immigrants | Norway | 99.9 /100 | #48 | Exceptional 52.2% |
| Immigrants | Austria | 99.9 /100 | #49 | Exceptional 52.1% |
| Asians | 99.9 /100 | #50 | Exceptional 52.1% |
| Immigrants | Greece | 99.9 /100 | #51 | Exceptional 52.1% |
| Bolivians | 99.8 /100 | #52 | Exceptional 52.0% |
| Immigrants | Asia | 99.8 /100 | #53 | Exceptional 52.0% |
| Immigrants | Spain | 99.8 /100 | #54 | Exceptional 51.9% |
| Australians | 99.8 /100 | #55 | Exceptional 51.9% |
| Immigrants | Czechoslovakia | 99.8 /100 | #56 | Exceptional 51.9% |
| Paraguayans | 99.8 /100 | #57 | Exceptional 51.8% |
| New Zealanders | 99.8 /100 | #58 | Exceptional 51.8% |
| Immigrants | Serbia | 99.8 /100 | #59 | Exceptional 51.7% |
| Immigrants | Bolivia | 99.7 /100 | #60 | Exceptional 51.5% |
| Immigrants | Kazakhstan | 99.7 /100 | #61 | Exceptional 51.4% |
| Bhutanese | 99.7 /100 | #62 | Exceptional 51.4% |
Demographics Similar to Immigrants from Brazil by Associate's Degree
In terms of associate's degree, the demographic groups most similar to Immigrants from Brazil are Laotian (49.9%, a difference of 0.13%), Immigrants from North America (50.1%, a difference of 0.15%), Immigrants from Western Asia (50.1%, a difference of 0.18%), Immigrants from Ethiopia (50.1%, a difference of 0.25%), and Immigrants from Western Europe (50.1%, a difference of 0.26%).
| Demographics | Rating | Rank | Associate's Degree |
| Immigrants | Croatia | 98.9 /100 | #86 | Exceptional 50.2% |
| Immigrants | Moldova | 98.8 /100 | #87 | Exceptional 50.2% |
| Immigrants | Canada | 98.7 /100 | #88 | Exceptional 50.1% |
| Immigrants | Western Europe | 98.7 /100 | #89 | Exceptional 50.1% |
| Immigrants | Ethiopia | 98.7 /100 | #90 | Exceptional 50.1% |
| Immigrants | Western Asia | 98.7 /100 | #91 | Exceptional 50.1% |
| Immigrants | North America | 98.7 /100 | #92 | Exceptional 50.1% |
| Immigrants | Brazil | 98.5 /100 | #93 | Exceptional 50.0% |
| Laotians | 98.4 /100 | #94 | Exceptional 49.9% |
| Immigrants | England | 98.0 /100 | #95 | Exceptional 49.7% |
| Romanians | 98.0 /100 | #96 | Exceptional 49.7% |
| Immigrants | Ukraine | 98.0 /100 | #97 | Exceptional 49.7% |
| Immigrants | Northern Africa | 97.9 /100 | #98 | Exceptional 49.7% |
| Macedonians | 97.8 /100 | #99 | Exceptional 49.6% |
| Immigrants | Nepal | 97.5 /100 | #100 | Exceptional 49.5% |