Assyrian/Chaldean/Syriac vs Immigrants from Brazil Associate's Degree
COMPARE
Assyrian/Chaldean/Syriac
Immigrants from Brazil
Associate's Degree
Associate's Degree Comparison
Assyrians/Chaldeans/Syriacs
Immigrants from Brazil
48.2%
ASSOCIATE'S DEGREE
89.4/ 100
METRIC RATING
133rd/ 347
METRIC RANK
50.0%
ASSOCIATE'S DEGREE
98.5/ 100
METRIC RATING
93rd/ 347
METRIC RANK
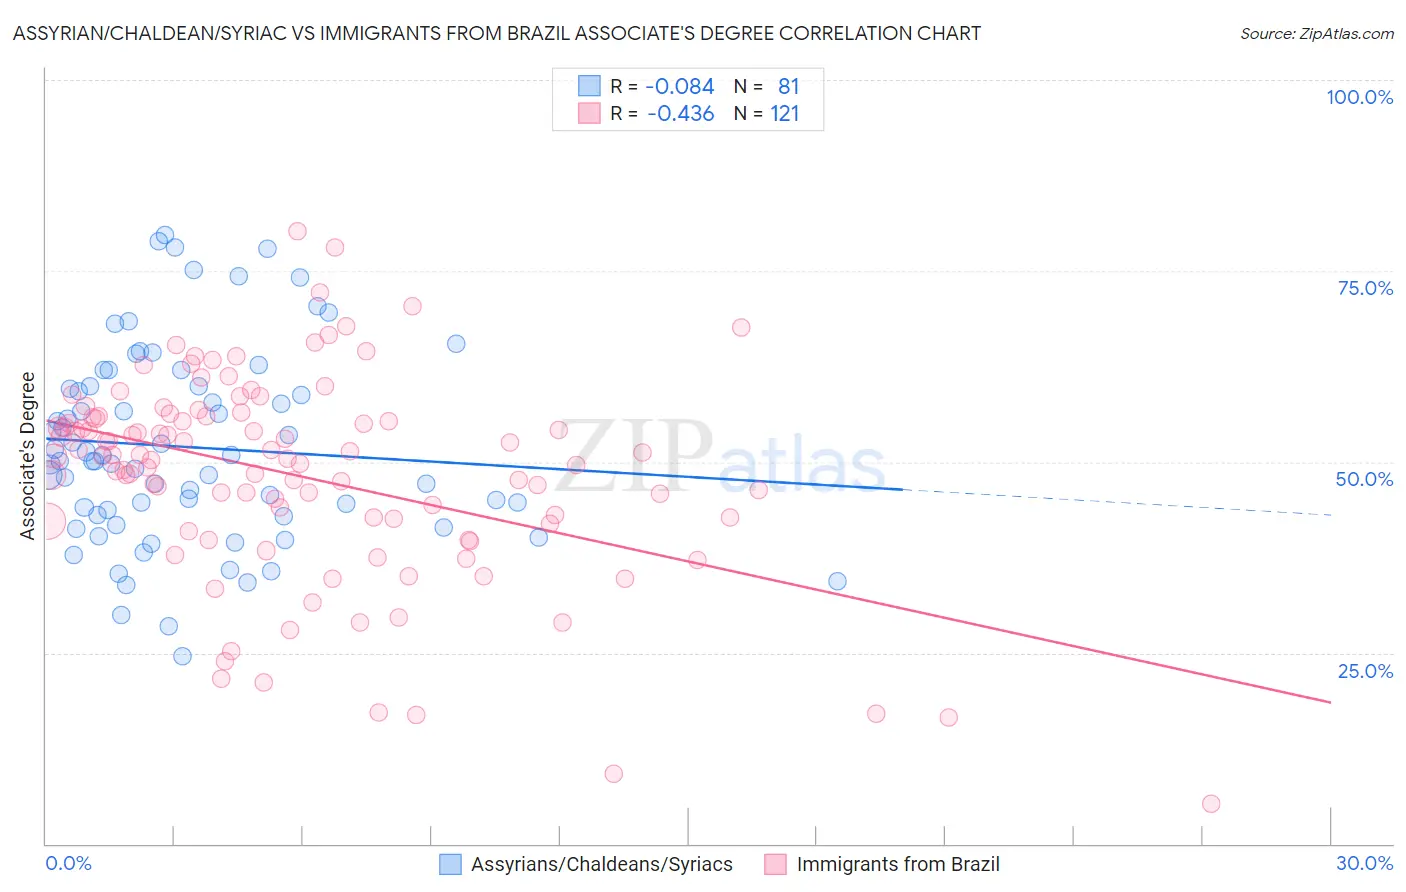
Assyrian/Chaldean/Syriac vs Immigrants from Brazil Associate's Degree Correlation Chart
The statistical analysis conducted on geographies consisting of 110,318,304 people shows a slight negative correlation between the proportion of Assyrians/Chaldeans/Syriacs and percentage of population with at least associate's degree education in the United States with a correlation coefficient (R) of -0.084 and weighted average of 48.2%. Similarly, the statistical analysis conducted on geographies consisting of 343,003,765 people shows a moderate negative correlation between the proportion of Immigrants from Brazil and percentage of population with at least associate's degree education in the United States with a correlation coefficient (R) of -0.436 and weighted average of 50.0%, a difference of 3.7%.
Associate's Degree Correlation Summary
| Measurement | Assyrian/Chaldean/Syriac | Immigrants from Brazil |
| Minimum | 24.5% | 5.3% |
| Maximum | 79.8% | 80.2% |
| Range | 55.3% | 75.0% |
| Mean | 51.9% | 48.1% |
| Median | 50.1% | 50.7% |
| Interquartile 25% (IQ1) | 43.0% | 42.1% |
| Interquartile 75% (IQ3) | 59.9% | 55.9% |
| Interquartile Range (IQR) | 16.9% | 13.7% |
| Standard Deviation (Sample) | 12.7% | 13.6% |
| Standard Deviation (Population) | 12.6% | 13.5% |
Similar Demographics by Associate's Degree
Demographics Similar to Assyrians/Chaldeans/Syriacs by Associate's Degree
In terms of associate's degree, the demographic groups most similar to Assyrians/Chaldeans/Syriacs are Moroccan (48.2%, a difference of 0.020%), Immigrants from Albania (48.2%, a difference of 0.080%), European (48.2%, a difference of 0.080%), Pakistani (48.1%, a difference of 0.26%), and Icelander (48.3%, a difference of 0.27%).
| Demographics | Rating | Rank | Associate's Degree |
| Immigrants | Syria | 92.2 /100 | #126 | Exceptional 48.5% |
| Immigrants | Uganda | 92.1 /100 | #127 | Exceptional 48.5% |
| Immigrants | Eastern Africa | 91.6 /100 | #128 | Exceptional 48.4% |
| Swedes | 91.5 /100 | #129 | Exceptional 48.4% |
| Immigrants | Jordan | 91.2 /100 | #130 | Exceptional 48.4% |
| Icelanders | 90.8 /100 | #131 | Exceptional 48.3% |
| Immigrants | Albania | 89.9 /100 | #132 | Excellent 48.2% |
| Assyrians/Chaldeans/Syriacs | 89.4 /100 | #133 | Excellent 48.2% |
| Moroccans | 89.3 /100 | #134 | Excellent 48.2% |
| Europeans | 89.0 /100 | #135 | Excellent 48.2% |
| Pakistanis | 88.0 /100 | #136 | Excellent 48.1% |
| Immigrants | Eritrea | 87.8 /100 | #137 | Excellent 48.1% |
| Poles | 87.3 /100 | #138 | Excellent 48.0% |
| Slovenes | 85.1 /100 | #139 | Excellent 47.9% |
| Immigrants | Southern Europe | 84.4 /100 | #140 | Excellent 47.8% |
Demographics Similar to Immigrants from Brazil by Associate's Degree
In terms of associate's degree, the demographic groups most similar to Immigrants from Brazil are Laotian (49.9%, a difference of 0.13%), Immigrants from North America (50.1%, a difference of 0.15%), Immigrants from Western Asia (50.1%, a difference of 0.18%), Immigrants from Ethiopia (50.1%, a difference of 0.25%), and Immigrants from Western Europe (50.1%, a difference of 0.26%).
| Demographics | Rating | Rank | Associate's Degree |
| Immigrants | Croatia | 98.9 /100 | #86 | Exceptional 50.2% |
| Immigrants | Moldova | 98.8 /100 | #87 | Exceptional 50.2% |
| Immigrants | Canada | 98.7 /100 | #88 | Exceptional 50.1% |
| Immigrants | Western Europe | 98.7 /100 | #89 | Exceptional 50.1% |
| Immigrants | Ethiopia | 98.7 /100 | #90 | Exceptional 50.1% |
| Immigrants | Western Asia | 98.7 /100 | #91 | Exceptional 50.1% |
| Immigrants | North America | 98.7 /100 | #92 | Exceptional 50.1% |
| Immigrants | Brazil | 98.5 /100 | #93 | Exceptional 50.0% |
| Laotians | 98.4 /100 | #94 | Exceptional 49.9% |
| Immigrants | England | 98.0 /100 | #95 | Exceptional 49.7% |
| Romanians | 98.0 /100 | #96 | Exceptional 49.7% |
| Immigrants | Ukraine | 98.0 /100 | #97 | Exceptional 49.7% |
| Immigrants | Northern Africa | 97.9 /100 | #98 | Exceptional 49.7% |
| Macedonians | 97.8 /100 | #99 | Exceptional 49.6% |
| Immigrants | Nepal | 97.5 /100 | #100 | Exceptional 49.5% |