Argentinean vs Immigrants from Brazil Associate's Degree
COMPARE
Argentinean
Immigrants from Brazil
Associate's Degree
Associate's Degree Comparison
Argentineans
Immigrants from Brazil
51.2%
ASSOCIATE'S DEGREE
99.6/ 100
METRIC RATING
67th/ 347
METRIC RANK
50.0%
ASSOCIATE'S DEGREE
98.5/ 100
METRIC RATING
93rd/ 347
METRIC RANK
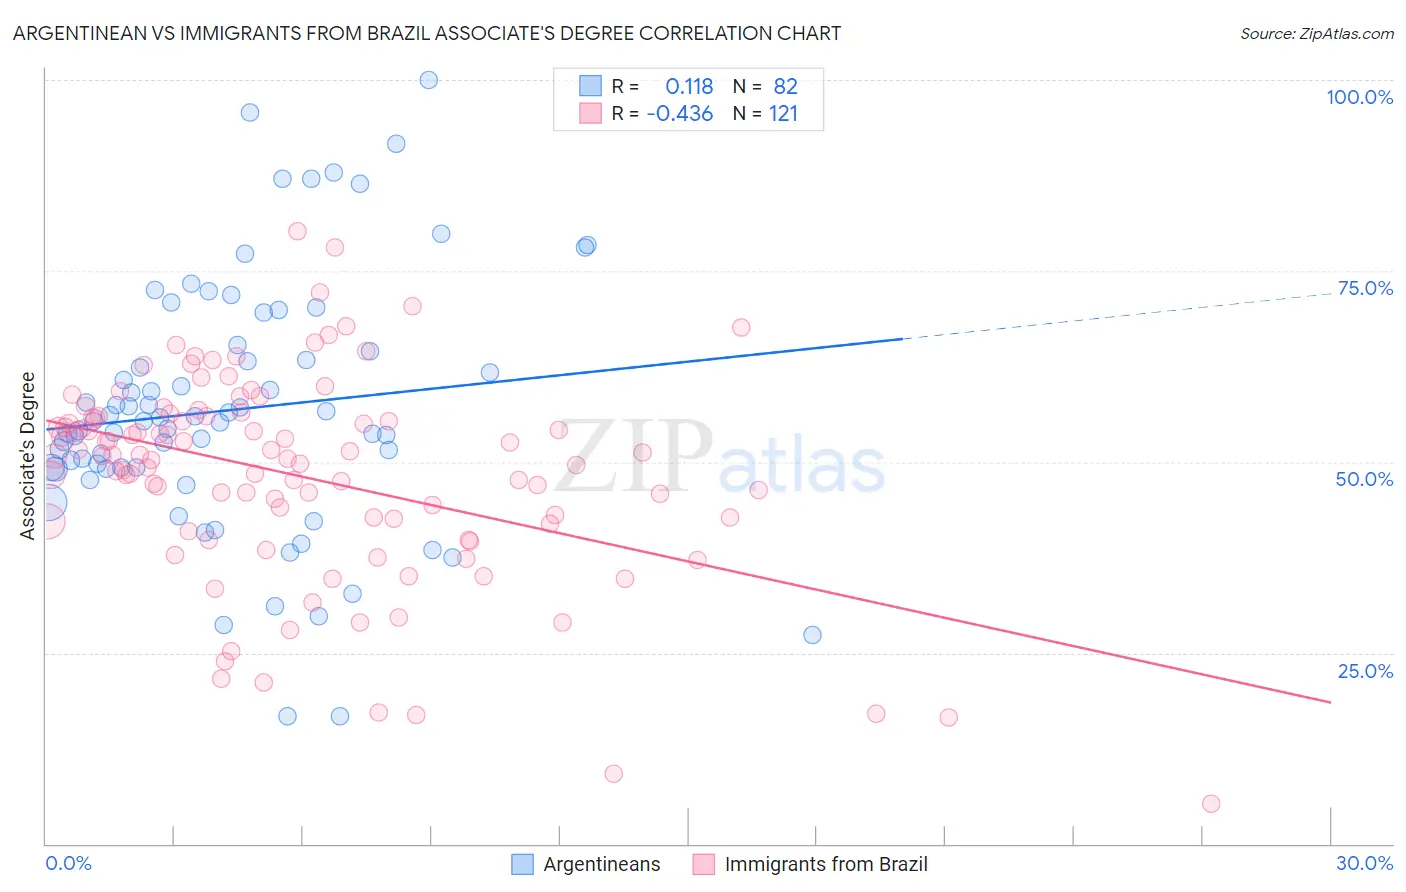
Argentinean vs Immigrants from Brazil Associate's Degree Correlation Chart
The statistical analysis conducted on geographies consisting of 297,131,671 people shows a poor positive correlation between the proportion of Argentineans and percentage of population with at least associate's degree education in the United States with a correlation coefficient (R) of 0.118 and weighted average of 51.2%. Similarly, the statistical analysis conducted on geographies consisting of 343,003,765 people shows a moderate negative correlation between the proportion of Immigrants from Brazil and percentage of population with at least associate's degree education in the United States with a correlation coefficient (R) of -0.436 and weighted average of 50.0%, a difference of 2.5%.
Associate's Degree Correlation Summary
| Measurement | Argentinean | Immigrants from Brazil |
| Minimum | 16.7% | 5.3% |
| Maximum | 100.0% | 80.2% |
| Range | 83.3% | 75.0% |
| Mean | 56.8% | 48.1% |
| Median | 55.3% | 50.7% |
| Interquartile 25% (IQ1) | 49.2% | 42.1% |
| Interquartile 75% (IQ3) | 64.5% | 55.9% |
| Interquartile Range (IQR) | 15.4% | 13.7% |
| Standard Deviation (Sample) | 16.6% | 13.6% |
| Standard Deviation (Population) | 16.5% | 13.5% |
Similar Demographics by Associate's Degree
Demographics Similar to Argentineans by Associate's Degree
In terms of associate's degree, the demographic groups most similar to Argentineans are Immigrants from Europe (51.3%, a difference of 0.13%), Zimbabwean (51.3%, a difference of 0.18%), Immigrants from Netherlands (51.4%, a difference of 0.22%), South African (51.4%, a difference of 0.29%), and Bhutanese (51.4%, a difference of 0.34%).
| Demographics | Rating | Rank | Associate's Degree |
| Immigrants | Bolivia | 99.7 /100 | #60 | Exceptional 51.5% |
| Immigrants | Kazakhstan | 99.7 /100 | #61 | Exceptional 51.4% |
| Bhutanese | 99.7 /100 | #62 | Exceptional 51.4% |
| South Africans | 99.7 /100 | #63 | Exceptional 51.4% |
| Immigrants | Netherlands | 99.7 /100 | #64 | Exceptional 51.4% |
| Zimbabweans | 99.7 /100 | #65 | Exceptional 51.3% |
| Immigrants | Europe | 99.7 /100 | #66 | Exceptional 51.3% |
| Argentineans | 99.6 /100 | #67 | Exceptional 51.2% |
| Immigrants | Indonesia | 99.5 /100 | #68 | Exceptional 51.0% |
| Egyptians | 99.5 /100 | #69 | Exceptional 50.9% |
| Immigrants | Argentina | 99.5 /100 | #70 | Exceptional 50.9% |
| Immigrants | Romania | 99.5 /100 | #71 | Exceptional 50.9% |
| Immigrants | Pakistan | 99.5 /100 | #72 | Exceptional 50.9% |
| Carpatho Rusyns | 99.3 /100 | #73 | Exceptional 50.6% |
| Lithuanians | 99.3 /100 | #74 | Exceptional 50.6% |
Demographics Similar to Immigrants from Brazil by Associate's Degree
In terms of associate's degree, the demographic groups most similar to Immigrants from Brazil are Laotian (49.9%, a difference of 0.13%), Immigrants from North America (50.1%, a difference of 0.15%), Immigrants from Western Asia (50.1%, a difference of 0.18%), Immigrants from Ethiopia (50.1%, a difference of 0.25%), and Immigrants from Western Europe (50.1%, a difference of 0.26%).
| Demographics | Rating | Rank | Associate's Degree |
| Immigrants | Croatia | 98.9 /100 | #86 | Exceptional 50.2% |
| Immigrants | Moldova | 98.8 /100 | #87 | Exceptional 50.2% |
| Immigrants | Canada | 98.7 /100 | #88 | Exceptional 50.1% |
| Immigrants | Western Europe | 98.7 /100 | #89 | Exceptional 50.1% |
| Immigrants | Ethiopia | 98.7 /100 | #90 | Exceptional 50.1% |
| Immigrants | Western Asia | 98.7 /100 | #91 | Exceptional 50.1% |
| Immigrants | North America | 98.7 /100 | #92 | Exceptional 50.1% |
| Immigrants | Brazil | 98.5 /100 | #93 | Exceptional 50.0% |
| Laotians | 98.4 /100 | #94 | Exceptional 49.9% |
| Immigrants | England | 98.0 /100 | #95 | Exceptional 49.7% |
| Romanians | 98.0 /100 | #96 | Exceptional 49.7% |
| Immigrants | Ukraine | 98.0 /100 | #97 | Exceptional 49.7% |
| Immigrants | Northern Africa | 97.9 /100 | #98 | Exceptional 49.7% |
| Macedonians | 97.8 /100 | #99 | Exceptional 49.6% |
| Immigrants | Nepal | 97.5 /100 | #100 | Exceptional 49.5% |