Immigrants from Congo vs Colville Bachelor's Degree
COMPARE
Immigrants from Congo
Colville
Bachelor's Degree
Bachelor's Degree Comparison
Immigrants from Congo
Colville
33.6%
BACHELOR'S DEGREE
1.0/ 100
METRIC RATING
247th/ 347
METRIC RANK
29.0%
BACHELOR'S DEGREE
0.0/ 100
METRIC RATING
317th/ 347
METRIC RANK
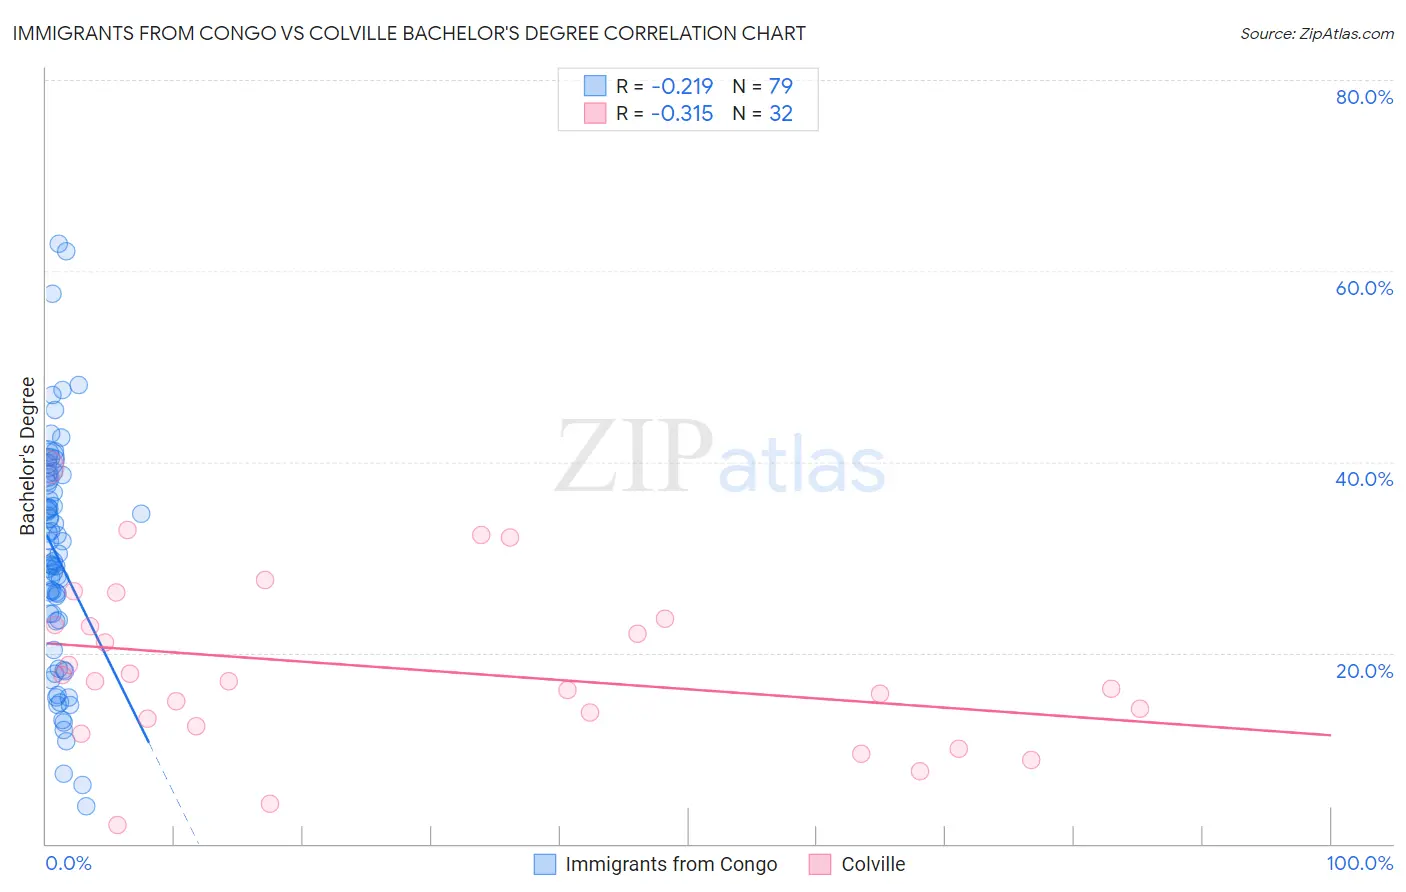
Immigrants from Congo vs Colville Bachelor's Degree Correlation Chart
The statistical analysis conducted on geographies consisting of 92,128,050 people shows a weak negative correlation between the proportion of Immigrants from Congo and percentage of population with at least bachelor's degree education in the United States with a correlation coefficient (R) of -0.219 and weighted average of 33.6%. Similarly, the statistical analysis conducted on geographies consisting of 34,683,925 people shows a mild negative correlation between the proportion of Colville and percentage of population with at least bachelor's degree education in the United States with a correlation coefficient (R) of -0.315 and weighted average of 29.0%, a difference of 15.8%.
Bachelor's Degree Correlation Summary
| Measurement | Immigrants from Congo | Colville |
| Minimum | 3.9% | 1.9% |
| Maximum | 62.9% | 39.5% |
| Range | 59.0% | 37.5% |
| Mean | 30.2% | 18.3% |
| Median | 30.0% | 17.0% |
| Interquartile 25% (IQ1) | 23.3% | 12.7% |
| Interquartile 75% (IQ3) | 38.4% | 23.2% |
| Interquartile Range (IQR) | 15.1% | 10.6% |
| Standard Deviation (Sample) | 12.1% | 8.7% |
| Standard Deviation (Population) | 12.0% | 8.6% |
Similar Demographics by Bachelor's Degree
Demographics Similar to Immigrants from Congo by Bachelor's Degree
In terms of bachelor's degree, the demographic groups most similar to Immigrants from Congo are Cree (33.6%, a difference of 0.010%), Jamaican (33.6%, a difference of 0.090%), Immigrants from Liberia (33.5%, a difference of 0.14%), Indonesian (33.5%, a difference of 0.15%), and Immigrants from Fiji (33.7%, a difference of 0.45%).
| Demographics | Rating | Rank | Bachelor's Degree |
| Tongans | 2.0 /100 | #240 | Tragic 34.3% |
| Immigrants | Cambodia | 1.9 /100 | #241 | Tragic 34.2% |
| Immigrants | Nonimmigrants | 1.8 /100 | #242 | Tragic 34.2% |
| Immigrants | Guyana | 1.4 /100 | #243 | Tragic 33.9% |
| Delaware | 1.2 /100 | #244 | Tragic 33.8% |
| Immigrants | Fiji | 1.2 /100 | #245 | Tragic 33.7% |
| Jamaicans | 1.0 /100 | #246 | Tragic 33.6% |
| Immigrants | Congo | 1.0 /100 | #247 | Tragic 33.6% |
| Cree | 1.0 /100 | #248 | Tragic 33.6% |
| Immigrants | Liberia | 0.9 /100 | #249 | Tragic 33.5% |
| Indonesians | 0.9 /100 | #250 | Tragic 33.5% |
| Japanese | 0.7 /100 | #251 | Tragic 33.3% |
| Immigrants | Bahamas | 0.7 /100 | #252 | Tragic 33.3% |
| U.S. Virgin Islanders | 0.7 /100 | #253 | Tragic 33.2% |
| Native Hawaiians | 0.7 /100 | #254 | Tragic 33.2% |
Demographics Similar to Colville by Bachelor's Degree
In terms of bachelor's degree, the demographic groups most similar to Colville are Yaqui (29.0%, a difference of 0.050%), Sioux (29.1%, a difference of 0.20%), Creek (28.9%, a difference of 0.50%), Kiowa (28.8%, a difference of 0.55%), and Alaskan Athabascan (28.8%, a difference of 0.63%).
| Demographics | Rating | Rank | Bachelor's Degree |
| Cheyenne | 0.0 /100 | #310 | Tragic 29.4% |
| Choctaw | 0.0 /100 | #311 | Tragic 29.4% |
| Seminole | 0.0 /100 | #312 | Tragic 29.4% |
| Alaska Natives | 0.0 /100 | #313 | Tragic 29.4% |
| Shoshone | 0.0 /100 | #314 | Tragic 29.3% |
| Immigrants | Cabo Verde | 0.0 /100 | #315 | Tragic 29.2% |
| Sioux | 0.0 /100 | #316 | Tragic 29.1% |
| Colville | 0.0 /100 | #317 | Tragic 29.0% |
| Yaqui | 0.0 /100 | #318 | Tragic 29.0% |
| Creek | 0.0 /100 | #319 | Tragic 28.9% |
| Kiowa | 0.0 /100 | #320 | Tragic 28.8% |
| Alaskan Athabascans | 0.0 /100 | #321 | Tragic 28.8% |
| Tsimshian | 0.0 /100 | #322 | Tragic 28.8% |
| Fijians | 0.0 /100 | #323 | Tragic 28.7% |
| Dutch West Indians | 0.0 /100 | #324 | Tragic 28.5% |