Indian (Asian) vs Colville Bachelor's Degree
COMPARE
Indian (Asian)
Colville
Bachelor's Degree
Bachelor's Degree Comparison
Indians (Asian)
Colville
47.4%
BACHELOR'S DEGREE
100.0/ 100
METRIC RATING
18th/ 347
METRIC RANK
29.0%
BACHELOR'S DEGREE
0.0/ 100
METRIC RATING
317th/ 347
METRIC RANK
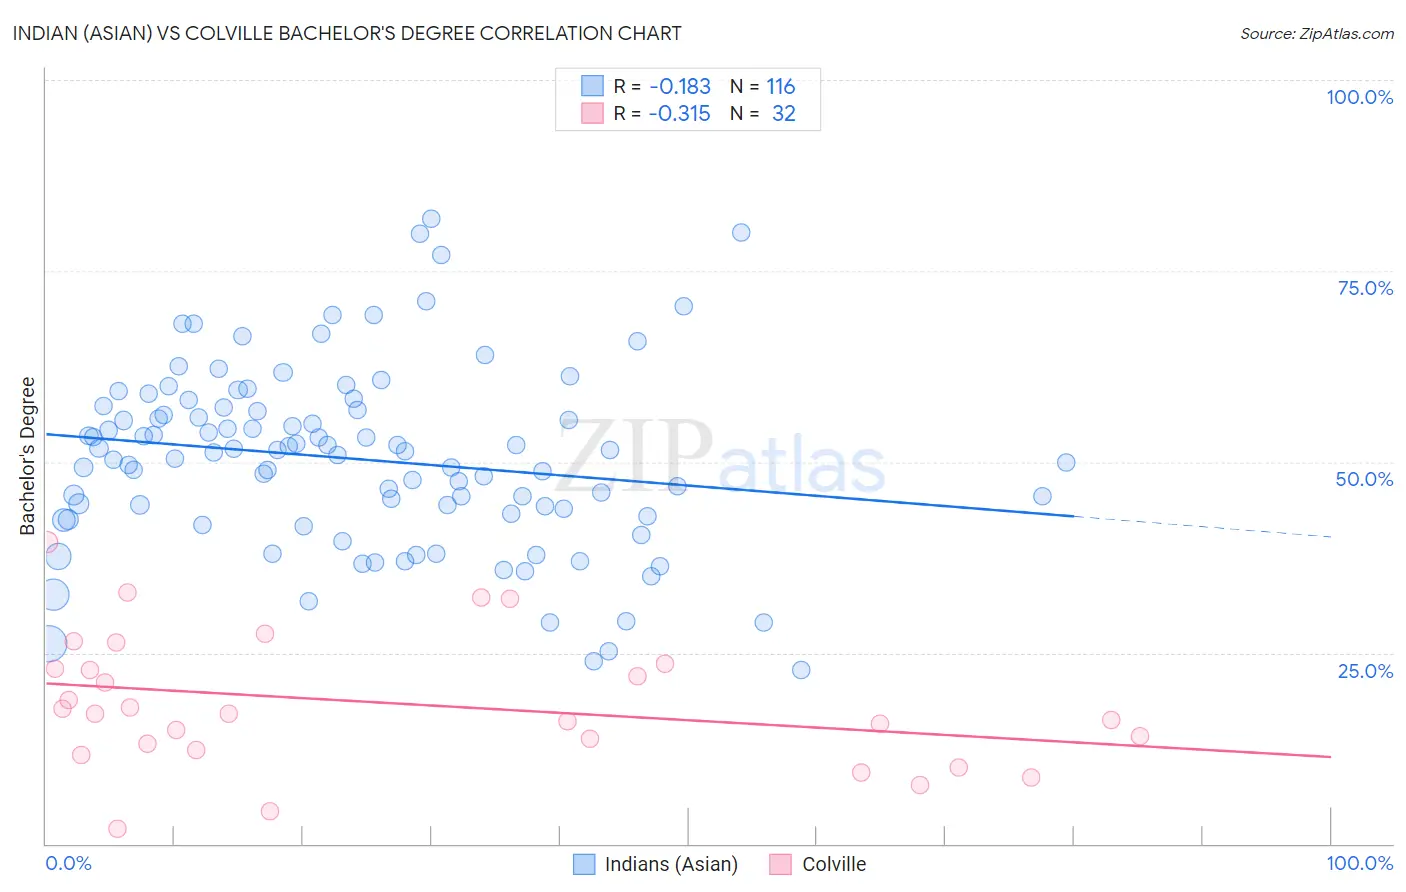
Indian (Asian) vs Colville Bachelor's Degree Correlation Chart
The statistical analysis conducted on geographies consisting of 495,247,229 people shows a poor negative correlation between the proportion of Indians (Asian) and percentage of population with at least bachelor's degree education in the United States with a correlation coefficient (R) of -0.183 and weighted average of 47.4%. Similarly, the statistical analysis conducted on geographies consisting of 34,683,925 people shows a mild negative correlation between the proportion of Colville and percentage of population with at least bachelor's degree education in the United States with a correlation coefficient (R) of -0.315 and weighted average of 29.0%, a difference of 63.6%.
Bachelor's Degree Correlation Summary
| Measurement | Indian (Asian) | Colville |
| Minimum | 22.8% | 1.9% |
| Maximum | 81.8% | 39.5% |
| Range | 59.0% | 37.5% |
| Mean | 50.4% | 18.3% |
| Median | 51.3% | 17.0% |
| Interquartile 25% (IQ1) | 43.1% | 12.7% |
| Interquartile 75% (IQ3) | 56.9% | 23.2% |
| Interquartile Range (IQR) | 13.9% | 10.6% |
| Standard Deviation (Sample) | 11.9% | 8.7% |
| Standard Deviation (Population) | 11.9% | 8.6% |
Similar Demographics by Bachelor's Degree
Demographics Similar to Indians (Asian) by Bachelor's Degree
In terms of bachelor's degree, the demographic groups most similar to Indians (Asian) are Eastern European (47.5%, a difference of 0.15%), Cambodian (47.2%, a difference of 0.43%), Immigrants from Switzerland (47.1%, a difference of 0.65%), Immigrants from Ireland (47.1%, a difference of 0.66%), and Immigrants from Belgium (47.0%, a difference of 0.86%).
| Demographics | Rating | Rank | Bachelor's Degree |
| Immigrants | Australia | 100.0 /100 | #11 | Exceptional 48.5% |
| Immigrants | China | 100.0 /100 | #12 | Exceptional 48.4% |
| Immigrants | South Central Asia | 100.0 /100 | #13 | Exceptional 48.3% |
| Immigrants | Hong Kong | 100.0 /100 | #14 | Exceptional 48.2% |
| Immigrants | Eastern Asia | 100.0 /100 | #15 | Exceptional 48.1% |
| Soviet Union | 100.0 /100 | #16 | Exceptional 47.9% |
| Eastern Europeans | 100.0 /100 | #17 | Exceptional 47.5% |
| Indians (Asian) | 100.0 /100 | #18 | Exceptional 47.4% |
| Cambodians | 100.0 /100 | #19 | Exceptional 47.2% |
| Immigrants | Switzerland | 100.0 /100 | #20 | Exceptional 47.1% |
| Immigrants | Ireland | 100.0 /100 | #21 | Exceptional 47.1% |
| Immigrants | Belgium | 100.0 /100 | #22 | Exceptional 47.0% |
| Immigrants | Sweden | 100.0 /100 | #23 | Exceptional 47.0% |
| Immigrants | Korea | 100.0 /100 | #24 | Exceptional 47.0% |
| Burmese | 100.0 /100 | #25 | Exceptional 46.9% |
Demographics Similar to Colville by Bachelor's Degree
In terms of bachelor's degree, the demographic groups most similar to Colville are Yaqui (29.0%, a difference of 0.050%), Sioux (29.1%, a difference of 0.20%), Creek (28.9%, a difference of 0.50%), Kiowa (28.8%, a difference of 0.55%), and Alaskan Athabascan (28.8%, a difference of 0.63%).
| Demographics | Rating | Rank | Bachelor's Degree |
| Cheyenne | 0.0 /100 | #310 | Tragic 29.4% |
| Choctaw | 0.0 /100 | #311 | Tragic 29.4% |
| Seminole | 0.0 /100 | #312 | Tragic 29.4% |
| Alaska Natives | 0.0 /100 | #313 | Tragic 29.4% |
| Shoshone | 0.0 /100 | #314 | Tragic 29.3% |
| Immigrants | Cabo Verde | 0.0 /100 | #315 | Tragic 29.2% |
| Sioux | 0.0 /100 | #316 | Tragic 29.1% |
| Colville | 0.0 /100 | #317 | Tragic 29.0% |
| Yaqui | 0.0 /100 | #318 | Tragic 29.0% |
| Creek | 0.0 /100 | #319 | Tragic 28.9% |
| Kiowa | 0.0 /100 | #320 | Tragic 28.8% |
| Alaskan Athabascans | 0.0 /100 | #321 | Tragic 28.8% |
| Tsimshian | 0.0 /100 | #322 | Tragic 28.8% |
| Fijians | 0.0 /100 | #323 | Tragic 28.7% |
| Dutch West Indians | 0.0 /100 | #324 | Tragic 28.5% |