Russian vs Immigrants from Laos Unemployment Among Ages 30 to 34 years
COMPARE
Russian
Immigrants from Laos
Unemployment Among Ages 30 to 34 years
Unemployment Among Ages 30 to 34 years Comparison
Russians
Immigrants from Laos
5.4%
UNEMPLOYMENT AMONG AGES 30 TO 34 YEARS
71.1/ 100
METRIC RATING
143rd/ 347
METRIC RANK
5.5%
UNEMPLOYMENT AMONG AGES 30 TO 34 YEARS
50.0/ 100
METRIC RATING
174th/ 347
METRIC RANK
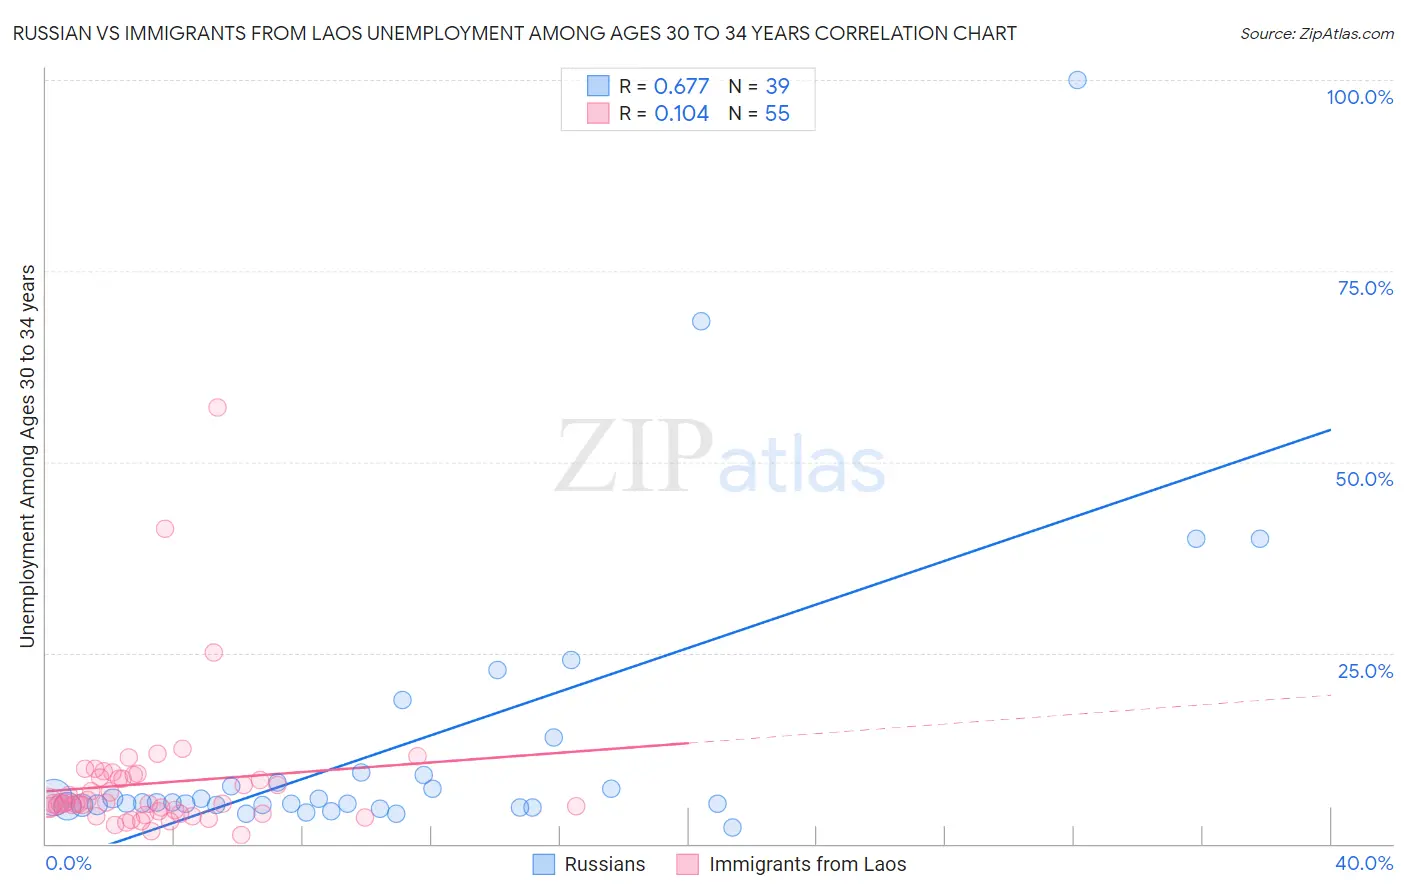
Russian vs Immigrants from Laos Unemployment Among Ages 30 to 34 years Correlation Chart
The statistical analysis conducted on geographies consisting of 461,775,023 people shows a significant positive correlation between the proportion of Russians and unemployment rate among population between the ages 30 and 34 in the United States with a correlation coefficient (R) of 0.677 and weighted average of 5.4%. Similarly, the statistical analysis conducted on geographies consisting of 195,849,707 people shows a poor positive correlation between the proportion of Immigrants from Laos and unemployment rate among population between the ages 30 and 34 in the United States with a correlation coefficient (R) of 0.104 and weighted average of 5.5%, a difference of 1.6%.
Unemployment Among Ages 30 to 34 years Correlation Summary
| Measurement | Russian | Immigrants from Laos |
| Minimum | 2.2% | 1.2% |
| Maximum | 100.0% | 57.1% |
| Range | 97.8% | 55.9% |
| Mean | 12.8% | 7.9% |
| Median | 5.3% | 5.3% |
| Interquartile 25% (IQ1) | 5.0% | 4.0% |
| Interquartile 75% (IQ3) | 8.9% | 8.7% |
| Interquartile Range (IQR) | 3.9% | 4.7% |
| Standard Deviation (Sample) | 19.3% | 9.0% |
| Standard Deviation (Population) | 19.0% | 8.9% |
Similar Demographics by Unemployment Among Ages 30 to 34 years
Demographics Similar to Russians by Unemployment Among Ages 30 to 34 years
In terms of unemployment among ages 30 to 34 years, the demographic groups most similar to Russians are Immigrants from Russia (5.4%, a difference of 0.020%), Immigrants from Europe (5.4%, a difference of 0.080%), Immigrants from Greece (5.4%, a difference of 0.080%), Syrian (5.4%, a difference of 0.080%), and Celtic (5.4%, a difference of 0.080%).
| Demographics | Rating | Rank | Unemployment Among Ages 30 to 34 years |
| Pakistanis | 74.6 /100 | #136 | Good 5.4% |
| Immigrants | Canada | 74.6 /100 | #137 | Good 5.4% |
| Serbians | 72.9 /100 | #138 | Good 5.4% |
| Lithuanians | 72.4 /100 | #139 | Good 5.4% |
| Immigrants | North America | 72.2 /100 | #140 | Good 5.4% |
| Immigrants | Europe | 72.1 /100 | #141 | Good 5.4% |
| Immigrants | Greece | 72.0 /100 | #142 | Good 5.4% |
| Russians | 71.1 /100 | #143 | Good 5.4% |
| Immigrants | Russia | 71.0 /100 | #144 | Good 5.4% |
| Syrians | 70.3 /100 | #145 | Good 5.4% |
| Celtics | 70.2 /100 | #146 | Good 5.4% |
| Ukrainians | 69.2 /100 | #147 | Good 5.4% |
| Immigrants | Iran | 69.1 /100 | #148 | Good 5.4% |
| Immigrants | Colombia | 68.9 /100 | #149 | Good 5.4% |
| Colombians | 68.7 /100 | #150 | Good 5.4% |
Demographics Similar to Immigrants from Laos by Unemployment Among Ages 30 to 34 years
In terms of unemployment among ages 30 to 34 years, the demographic groups most similar to Immigrants from Laos are Peruvian (5.5%, a difference of 0.010%), Afghan (5.5%, a difference of 0.030%), Immigrants from Austria (5.5%, a difference of 0.090%), Scottish (5.5%, a difference of 0.12%), and Immigrants from Peru (5.5%, a difference of 0.14%).
| Demographics | Rating | Rank | Unemployment Among Ages 30 to 34 years |
| English | 54.8 /100 | #167 | Average 5.4% |
| South Americans | 52.9 /100 | #168 | Average 5.4% |
| Immigrants | Israel | 52.9 /100 | #169 | Average 5.4% |
| Dutch | 52.6 /100 | #170 | Average 5.5% |
| Scottish | 51.8 /100 | #171 | Average 5.5% |
| Immigrants | Austria | 51.3 /100 | #172 | Average 5.5% |
| Peruvians | 50.2 /100 | #173 | Average 5.5% |
| Immigrants | Laos | 50.0 /100 | #174 | Average 5.5% |
| Afghans | 49.6 /100 | #175 | Average 5.5% |
| Immigrants | Peru | 48.0 /100 | #176 | Average 5.5% |
| Immigrants | Ukraine | 47.7 /100 | #177 | Average 5.5% |
| Macedonians | 47.1 /100 | #178 | Average 5.5% |
| Costa Ricans | 46.7 /100 | #179 | Average 5.5% |
| Italians | 45.5 /100 | #180 | Average 5.5% |
| Immigrants | Lebanon | 43.5 /100 | #181 | Average 5.5% |