Russian vs Costa Rican College, Under 1 year
COMPARE
Russian
Costa Rican
College, Under 1 year
College, Under 1 year Comparison
Russians
Costa Ricans
70.5%
COLLEGE, UNDER 1 YEAR
99.9/ 100
METRIC RATING
35th/ 347
METRIC RANK
64.4%
COLLEGE, UNDER 1 YEAR
19.6/ 100
METRIC RATING
197th/ 347
METRIC RANK
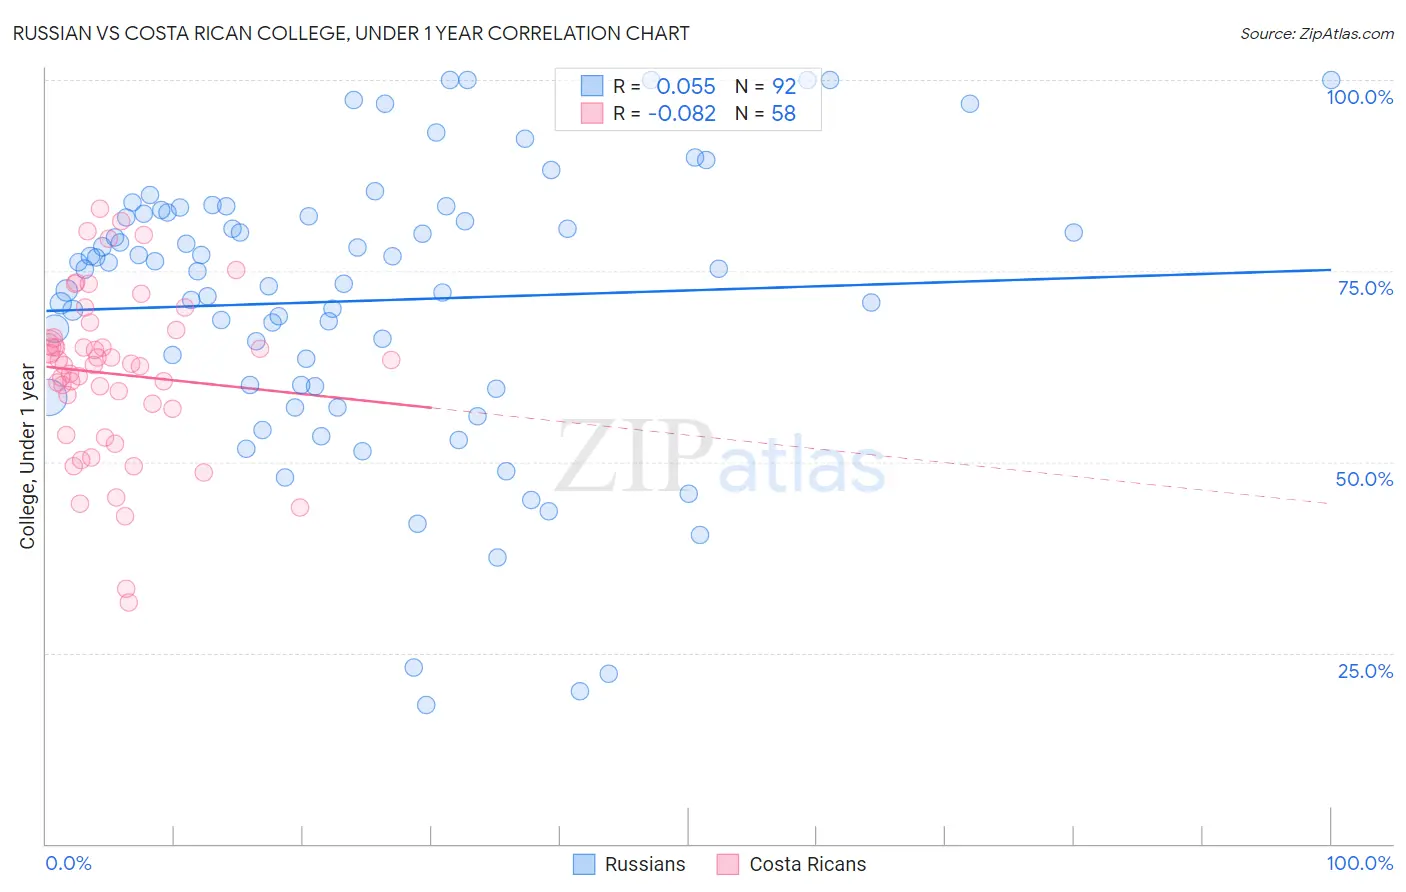
Russian vs Costa Rican College, Under 1 year Correlation Chart
The statistical analysis conducted on geographies consisting of 512,255,371 people shows a slight positive correlation between the proportion of Russians and percentage of population with at least college, under 1 year education in the United States with a correlation coefficient (R) of 0.055 and weighted average of 70.5%. Similarly, the statistical analysis conducted on geographies consisting of 253,601,310 people shows a slight negative correlation between the proportion of Costa Ricans and percentage of population with at least college, under 1 year education in the United States with a correlation coefficient (R) of -0.082 and weighted average of 64.4%, a difference of 9.5%.
College, Under 1 year Correlation Summary
| Measurement | Russian | Costa Rican |
| Minimum | 18.2% | 31.6% |
| Maximum | 100.0% | 83.1% |
| Range | 81.8% | 51.5% |
| Mean | 71.1% | 61.5% |
| Median | 75.2% | 62.8% |
| Interquartile 25% (IQ1) | 60.0% | 56.9% |
| Interquartile 75% (IQ3) | 82.5% | 66.2% |
| Interquartile Range (IQR) | 22.5% | 9.3% |
| Standard Deviation (Sample) | 18.5% | 10.9% |
| Standard Deviation (Population) | 18.4% | 10.8% |
Similar Demographics by College, Under 1 year
Demographics Similar to Russians by College, Under 1 year
In terms of college, under 1 year, the demographic groups most similar to Russians are Immigrants from Sri Lanka (70.5%, a difference of 0.060%), Estonian (70.6%, a difference of 0.080%), Immigrants from South Africa (70.6%, a difference of 0.10%), Immigrants from Saudi Arabia (70.4%, a difference of 0.17%), and Australian (70.4%, a difference of 0.25%).
| Demographics | Rating | Rank | College, Under 1 year |
| Immigrants | Hong Kong | 100.0 /100 | #28 | Exceptional 71.0% |
| Immigrants | France | 100.0 /100 | #29 | Exceptional 71.0% |
| Immigrants | China | 99.9 /100 | #30 | Exceptional 70.9% |
| Indians (Asian) | 99.9 /100 | #31 | Exceptional 70.8% |
| Turks | 99.9 /100 | #32 | Exceptional 70.7% |
| Immigrants | South Africa | 99.9 /100 | #33 | Exceptional 70.6% |
| Estonians | 99.9 /100 | #34 | Exceptional 70.6% |
| Russians | 99.9 /100 | #35 | Exceptional 70.5% |
| Immigrants | Sri Lanka | 99.9 /100 | #36 | Exceptional 70.5% |
| Immigrants | Saudi Arabia | 99.9 /100 | #37 | Exceptional 70.4% |
| Australians | 99.9 /100 | #38 | Exceptional 70.4% |
| Bhutanese | 99.9 /100 | #39 | Exceptional 70.3% |
| Immigrants | Turkey | 99.9 /100 | #40 | Exceptional 70.3% |
| Immigrants | Kuwait | 99.9 /100 | #41 | Exceptional 70.3% |
| Immigrants | Lithuania | 99.9 /100 | #42 | Exceptional 70.3% |
Demographics Similar to Costa Ricans by College, Under 1 year
In terms of college, under 1 year, the demographic groups most similar to Costa Ricans are Tongan (64.5%, a difference of 0.11%), Tsimshian (64.3%, a difference of 0.13%), Immigrants from South Eastern Asia (64.5%, a difference of 0.17%), Panamanian (64.3%, a difference of 0.19%), and Nigerian (64.3%, a difference of 0.22%).
| Demographics | Rating | Rank | College, Under 1 year |
| Immigrants | Philippines | 30.1 /100 | #190 | Fair 64.8% |
| Immigrants | Armenia | 28.1 /100 | #191 | Fair 64.7% |
| Immigrants | Thailand | 27.0 /100 | #192 | Fair 64.7% |
| Slovaks | 26.7 /100 | #193 | Fair 64.7% |
| Immigrants | Cameroon | 24.6 /100 | #194 | Fair 64.6% |
| Immigrants | South Eastern Asia | 22.1 /100 | #195 | Fair 64.5% |
| Tongans | 21.2 /100 | #196 | Fair 64.5% |
| Costa Ricans | 19.6 /100 | #197 | Poor 64.4% |
| Tsimshian | 17.9 /100 | #198 | Poor 64.3% |
| Panamanians | 17.0 /100 | #199 | Poor 64.3% |
| Nigerians | 16.7 /100 | #200 | Poor 64.3% |
| French Canadians | 16.3 /100 | #201 | Poor 64.2% |
| South Americans | 16.2 /100 | #202 | Poor 64.2% |
| Uruguayans | 15.6 /100 | #203 | Poor 64.2% |
| Immigrants | Zaire | 14.6 /100 | #204 | Poor 64.1% |