Samoan vs Immigrants from Romania Master's Degree
COMPARE
Samoan
Immigrants from Romania
Master's Degree
Master's Degree Comparison
Samoans
Immigrants from Romania
11.5%
MASTER'S DEGREE
0.1/ 100
METRIC RATING
298th/ 347
METRIC RANK
17.7%
MASTER'S DEGREE
99.7/ 100
METRIC RATING
74th/ 347
METRIC RANK
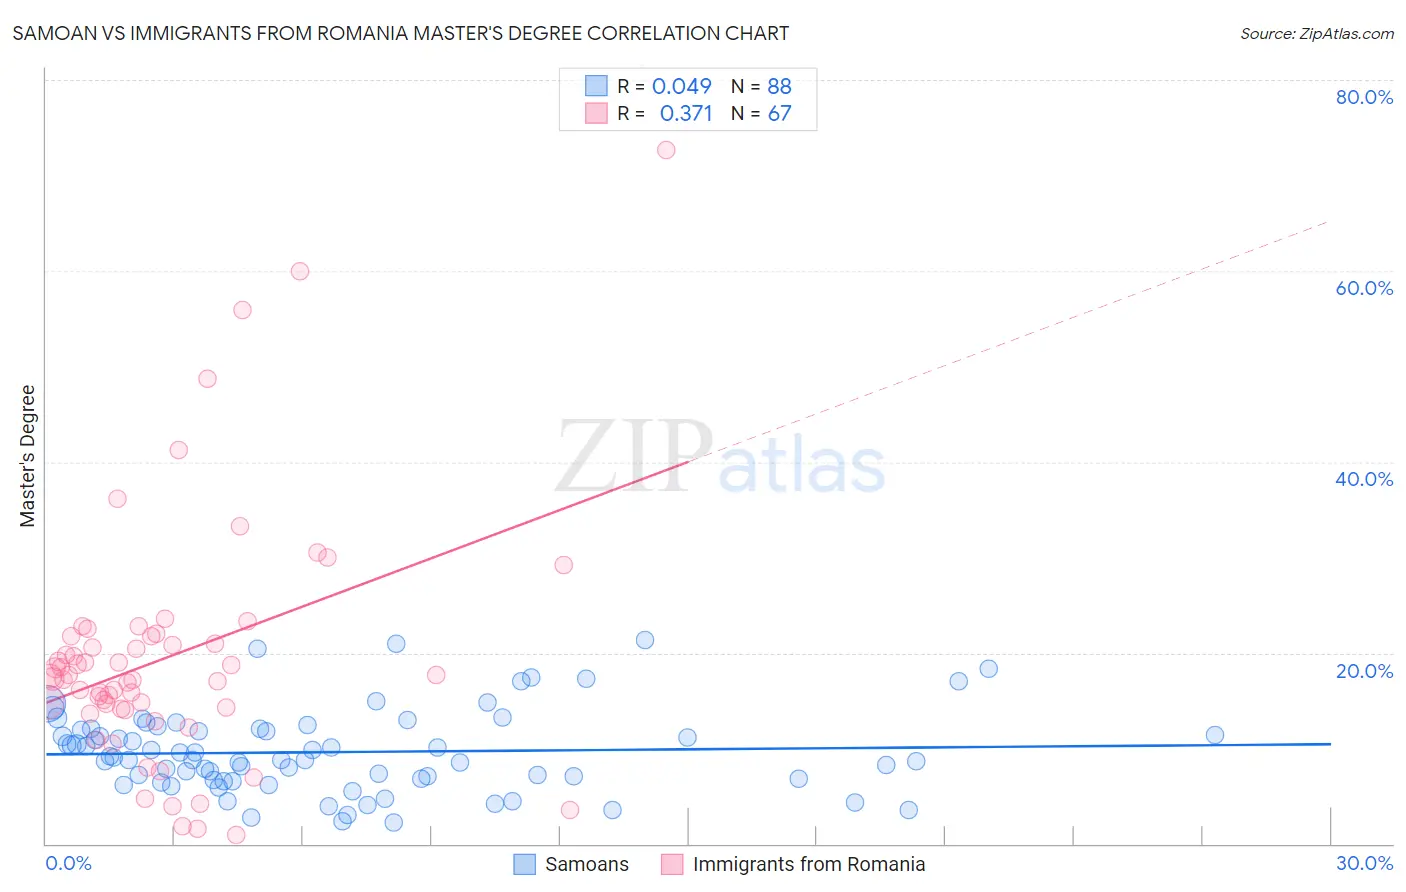
Samoan vs Immigrants from Romania Master's Degree Correlation Chart
The statistical analysis conducted on geographies consisting of 225,135,673 people shows no correlation between the proportion of Samoans and percentage of population with at least master's degree education in the United States with a correlation coefficient (R) of 0.049 and weighted average of 11.5%. Similarly, the statistical analysis conducted on geographies consisting of 256,994,499 people shows a mild positive correlation between the proportion of Immigrants from Romania and percentage of population with at least master's degree education in the United States with a correlation coefficient (R) of 0.371 and weighted average of 17.7%, a difference of 54.0%.
Master's Degree Correlation Summary
| Measurement | Samoan | Immigrants from Romania |
| Minimum | 2.3% | 0.91% |
| Maximum | 21.3% | 72.6% |
| Range | 19.0% | 71.7% |
| Mean | 9.6% | 19.6% |
| Median | 8.9% | 17.5% |
| Interquartile 25% (IQ1) | 6.7% | 14.1% |
| Interquartile 75% (IQ3) | 12.0% | 21.8% |
| Interquartile Range (IQR) | 5.3% | 7.7% |
| Standard Deviation (Sample) | 4.2% | 12.9% |
| Standard Deviation (Population) | 4.2% | 12.8% |
Similar Demographics by Master's Degree
Demographics Similar to Samoans by Master's Degree
In terms of master's degree, the demographic groups most similar to Samoans are Chickasaw (11.4%, a difference of 0.46%), Chippewa (11.4%, a difference of 0.48%), Tsimshian (11.4%, a difference of 0.64%), Immigrants from Yemen (11.6%, a difference of 0.71%), and Marshallese (11.6%, a difference of 0.84%).
| Demographics | Rating | Rank | Master's Degree |
| Colville | 0.1 /100 | #291 | Tragic 11.6% |
| Immigrants | Guatemala | 0.1 /100 | #292 | Tragic 11.6% |
| Alaska Natives | 0.1 /100 | #293 | Tragic 11.6% |
| Hawaiians | 0.1 /100 | #294 | Tragic 11.6% |
| Marshallese | 0.1 /100 | #295 | Tragic 11.6% |
| Alaskan Athabascans | 0.1 /100 | #296 | Tragic 11.6% |
| Immigrants | Yemen | 0.1 /100 | #297 | Tragic 11.6% |
| Samoans | 0.1 /100 | #298 | Tragic 11.5% |
| Chickasaw | 0.1 /100 | #299 | Tragic 11.4% |
| Chippewa | 0.1 /100 | #300 | Tragic 11.4% |
| Tsimshian | 0.1 /100 | #301 | Tragic 11.4% |
| Cherokee | 0.1 /100 | #302 | Tragic 11.4% |
| Immigrants | Laos | 0.1 /100 | #303 | Tragic 11.4% |
| Immigrants | Cabo Verde | 0.1 /100 | #304 | Tragic 11.3% |
| Immigrants | Latin America | 0.0 /100 | #305 | Tragic 11.3% |
Demographics Similar to Immigrants from Romania by Master's Degree
In terms of master's degree, the demographic groups most similar to Immigrants from Romania are Zimbabwean (17.7%, a difference of 0.31%), Egyptian (17.6%, a difference of 0.38%), Immigrants from Indonesia (17.6%, a difference of 0.40%), Lithuanian (17.7%, a difference of 0.41%), and Immigrants from Eastern Europe (17.6%, a difference of 0.52%).
| Demographics | Rating | Rank | Master's Degree |
| Immigrants | Argentina | 99.8 /100 | #67 | Exceptional 18.0% |
| Immigrants | Ethiopia | 99.8 /100 | #68 | Exceptional 17.9% |
| Immigrants | Uzbekistan | 99.8 /100 | #69 | Exceptional 17.9% |
| Immigrants | Western Europe | 99.8 /100 | #70 | Exceptional 17.8% |
| Immigrants | Pakistan | 99.7 /100 | #71 | Exceptional 17.8% |
| Lithuanians | 99.7 /100 | #72 | Exceptional 17.7% |
| Zimbabweans | 99.7 /100 | #73 | Exceptional 17.7% |
| Immigrants | Romania | 99.7 /100 | #74 | Exceptional 17.7% |
| Egyptians | 99.6 /100 | #75 | Exceptional 17.6% |
| Immigrants | Indonesia | 99.6 /100 | #76 | Exceptional 17.6% |
| Immigrants | Eastern Europe | 99.6 /100 | #77 | Exceptional 17.6% |
| Immigrants | Hungary | 99.6 /100 | #78 | Exceptional 17.5% |
| Immigrants | Lebanon | 99.6 /100 | #79 | Exceptional 17.5% |
| Carpatho Rusyns | 99.6 /100 | #80 | Exceptional 17.5% |
| Immigrants | Western Asia | 99.5 /100 | #81 | Exceptional 17.5% |