Puerto Rican vs British Cognitive Disability
COMPARE
Puerto Rican
British
Cognitive Disability
Cognitive Disability Comparison
Puerto Ricans
British
19.2%
COGNITIVE DISABILITY
0.0/ 100
METRIC RATING
339th/ 347
METRIC RANK
17.0%
COGNITIVE DISABILITY
89.3/ 100
METRIC RATING
143rd/ 347
METRIC RANK
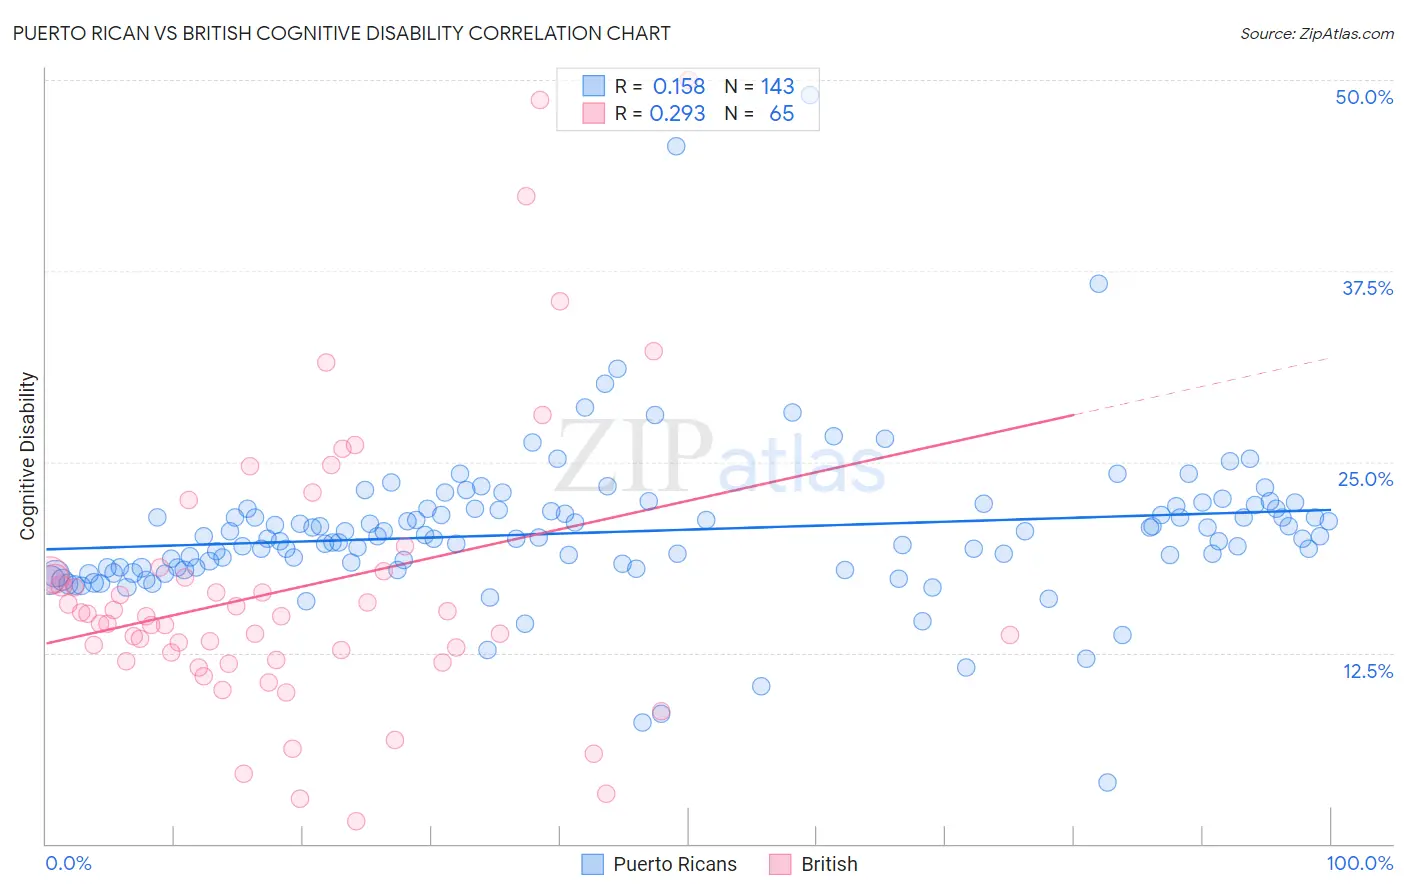
Puerto Rican vs British Cognitive Disability Correlation Chart
The statistical analysis conducted on geographies consisting of 528,170,098 people shows a poor positive correlation between the proportion of Puerto Ricans and percentage of population with cognitive disability in the United States with a correlation coefficient (R) of 0.158 and weighted average of 19.2%. Similarly, the statistical analysis conducted on geographies consisting of 531,402,976 people shows a weak positive correlation between the proportion of British and percentage of population with cognitive disability in the United States with a correlation coefficient (R) of 0.293 and weighted average of 17.0%, a difference of 12.9%.
Cognitive Disability Correlation Summary
| Measurement | Puerto Rican | British |
| Minimum | 4.0% | 1.5% |
| Maximum | 49.0% | 50.0% |
| Range | 44.9% | 48.5% |
| Mean | 20.4% | 16.7% |
| Median | 20.1% | 14.9% |
| Interquartile 25% (IQ1) | 18.1% | 12.0% |
| Interquartile 75% (IQ3) | 21.9% | 17.7% |
| Interquartile Range (IQR) | 3.8% | 5.7% |
| Standard Deviation (Sample) | 5.2% | 9.5% |
| Standard Deviation (Population) | 5.1% | 9.4% |
Similar Demographics by Cognitive Disability
Demographics Similar to Puerto Ricans by Cognitive Disability
In terms of cognitive disability, the demographic groups most similar to Puerto Ricans are Cape Verdean (19.2%, a difference of 0.020%), Tohono O'odham (19.3%, a difference of 0.26%), Houma (19.3%, a difference of 0.26%), Lumbee (19.1%, a difference of 0.47%), and Immigrants from Saudi Arabia (19.1%, a difference of 0.82%).
| Demographics | Rating | Rank | Cognitive Disability |
| Immigrants | Sudan | 0.0 /100 | #332 | Tragic 18.8% |
| Immigrants | Yemen | 0.0 /100 | #333 | Tragic 18.8% |
| Sudanese | 0.0 /100 | #334 | Tragic 18.9% |
| Senegalese | 0.0 /100 | #335 | Tragic 19.0% |
| Blacks/African Americans | 0.0 /100 | #336 | Tragic 19.0% |
| Immigrants | Saudi Arabia | 0.0 /100 | #337 | Tragic 19.1% |
| Lumbee | 0.0 /100 | #338 | Tragic 19.1% |
| Puerto Ricans | 0.0 /100 | #339 | Tragic 19.2% |
| Cape Verdeans | 0.0 /100 | #340 | Tragic 19.2% |
| Tohono O'odham | 0.0 /100 | #341 | Tragic 19.3% |
| Houma | 0.0 /100 | #342 | Tragic 19.3% |
| Immigrants | Zaire | 0.0 /100 | #343 | Tragic 19.4% |
| Immigrants | Congo | 0.0 /100 | #344 | Tragic 19.7% |
| Somalis | 0.0 /100 | #345 | Tragic 19.8% |
| Immigrants | Cabo Verde | 0.0 /100 | #346 | Tragic 19.9% |
Demographics Similar to British by Cognitive Disability
In terms of cognitive disability, the demographic groups most similar to British are Immigrants from Brazil (17.0%, a difference of 0.0%), Carpatho Rusyn (17.0%, a difference of 0.020%), French (17.0%, a difference of 0.050%), Chilean (17.0%, a difference of 0.050%), and Aleut (17.0%, a difference of 0.050%).
| Demographics | Rating | Rank | Cognitive Disability |
| Israelis | 91.0 /100 | #136 | Exceptional 17.0% |
| Immigrants | Norway | 90.9 /100 | #137 | Exceptional 17.0% |
| Welsh | 90.8 /100 | #138 | Exceptional 17.0% |
| French | 90.0 /100 | #139 | Excellent 17.0% |
| Chileans | 89.9 /100 | #140 | Excellent 17.0% |
| Aleuts | 89.9 /100 | #141 | Excellent 17.0% |
| Carpatho Rusyns | 89.6 /100 | #142 | Excellent 17.0% |
| British | 89.3 /100 | #143 | Excellent 17.0% |
| Immigrants | Brazil | 89.3 /100 | #144 | Excellent 17.0% |
| Immigrants | South Eastern Asia | 88.7 /100 | #145 | Excellent 17.0% |
| Costa Ricans | 88.0 /100 | #146 | Excellent 17.0% |
| Scotch-Irish | 85.9 /100 | #147 | Excellent 17.1% |
| French Canadians | 85.7 /100 | #148 | Excellent 17.1% |
| Cypriots | 85.7 /100 | #149 | Excellent 17.1% |
| Basques | 85.5 /100 | #150 | Excellent 17.1% |