Norwegian vs Puget Sound Salish College, 1 year or more
COMPARE
Norwegian
Puget Sound Salish
College, 1 year or more
College, 1 year or more Comparison
Norwegians
Puget Sound Salish
61.7%
COLLEGE, 1 YEAR OR MORE
94.5/ 100
METRIC RATING
115th/ 347
METRIC RANK
55.9%
COLLEGE, 1 YEAR OR MORE
1.1/ 100
METRIC RATING
239th/ 347
METRIC RANK
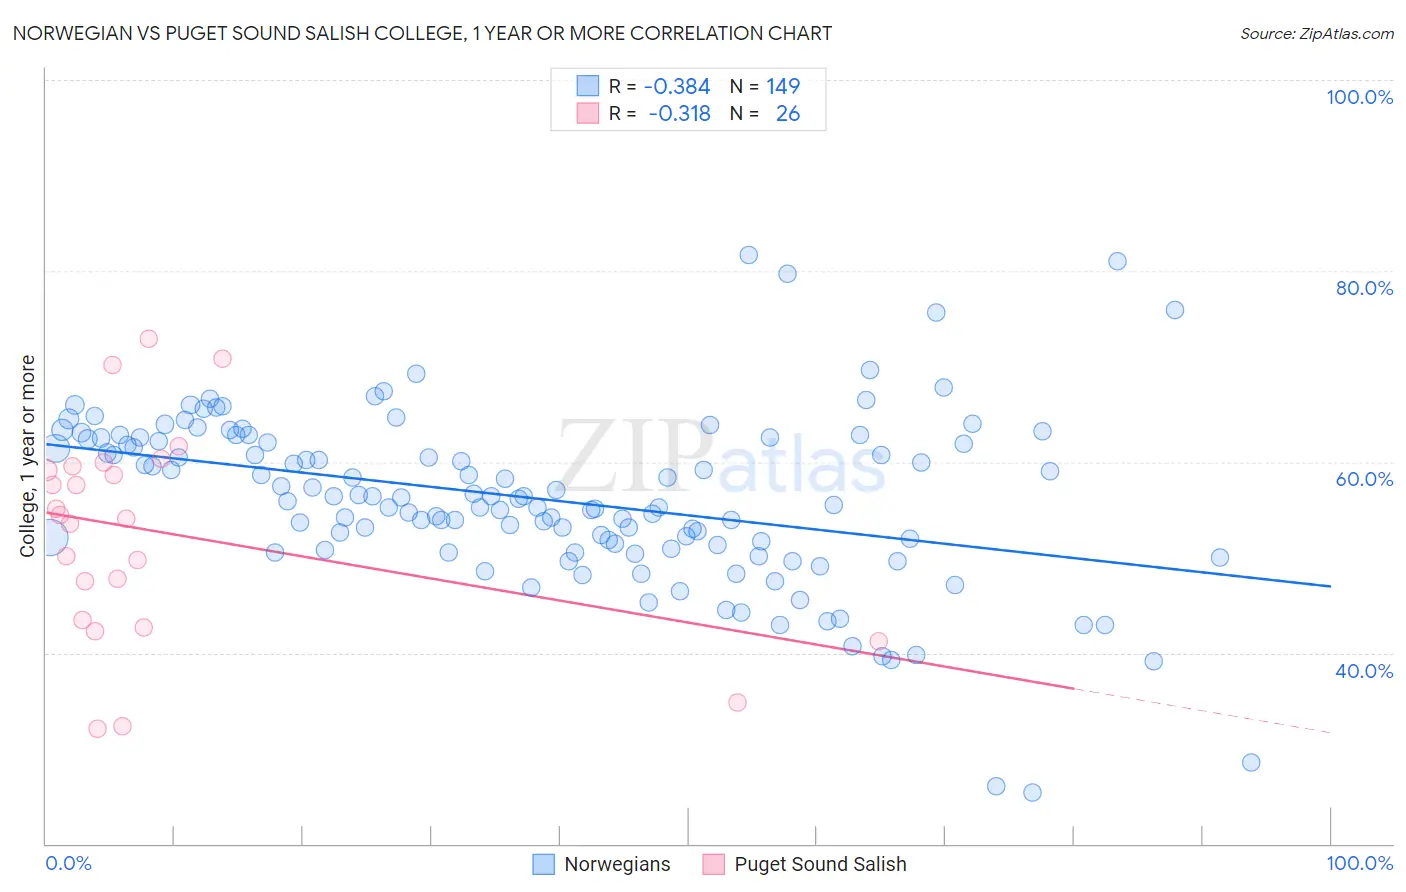
Norwegian vs Puget Sound Salish College, 1 year or more Correlation Chart
The statistical analysis conducted on geographies consisting of 533,389,627 people shows a mild negative correlation between the proportion of Norwegians and percentage of population with at least college, 1 year or more education in the United States with a correlation coefficient (R) of -0.384 and weighted average of 61.7%. Similarly, the statistical analysis conducted on geographies consisting of 46,155,865 people shows a mild negative correlation between the proportion of Puget Sound Salish and percentage of population with at least college, 1 year or more education in the United States with a correlation coefficient (R) of -0.318 and weighted average of 55.9%, a difference of 10.3%.
College, 1 year or more Correlation Summary
| Measurement | Norwegian | Puget Sound Salish |
| Minimum | 25.4% | 32.1% |
| Maximum | 81.7% | 72.9% |
| Range | 56.3% | 40.8% |
| Mean | 56.1% | 52.7% |
| Median | 56.3% | 54.3% |
| Interquartile 25% (IQ1) | 51.0% | 43.4% |
| Interquartile 75% (IQ3) | 62.5% | 59.6% |
| Interquartile Range (IQR) | 11.4% | 16.2% |
| Standard Deviation (Sample) | 9.1% | 11.1% |
| Standard Deviation (Population) | 9.1% | 10.9% |
Similar Demographics by College, 1 year or more
Demographics Similar to Norwegians by College, 1 year or more
In terms of college, 1 year or more, the demographic groups most similar to Norwegians are Danish (61.7%, a difference of 0.070%), Lebanese (61.6%, a difference of 0.10%), Arab (61.6%, a difference of 0.14%), Immigrants from Brazil (61.6%, a difference of 0.15%), and Ukrainian (61.8%, a difference of 0.18%).
| Demographics | Rating | Rank | College, 1 year or more |
| Syrians | 95.7 /100 | #108 | Exceptional 61.9% |
| Immigrants | Northern Africa | 95.7 /100 | #109 | Exceptional 61.9% |
| Europeans | 95.6 /100 | #110 | Exceptional 61.8% |
| Macedonians | 95.6 /100 | #111 | Exceptional 61.8% |
| Austrians | 95.4 /100 | #112 | Exceptional 61.8% |
| Ukrainians | 95.2 /100 | #113 | Exceptional 61.8% |
| Danes | 94.8 /100 | #114 | Exceptional 61.7% |
| Norwegians | 94.5 /100 | #115 | Exceptional 61.7% |
| Lebanese | 94.1 /100 | #116 | Exceptional 61.6% |
| Arabs | 93.9 /100 | #117 | Exceptional 61.6% |
| Immigrants | Brazil | 93.9 /100 | #118 | Exceptional 61.6% |
| Assyrians/Chaldeans/Syriacs | 93.3 /100 | #119 | Exceptional 61.5% |
| Pakistanis | 93.2 /100 | #120 | Exceptional 61.5% |
| Immigrants | Jordan | 92.7 /100 | #121 | Exceptional 61.4% |
| Immigrants | Chile | 92.3 /100 | #122 | Exceptional 61.4% |
Demographics Similar to Puget Sound Salish by College, 1 year or more
In terms of college, 1 year or more, the demographic groups most similar to Puget Sound Salish are Trinidadian and Tobagonian (55.8%, a difference of 0.090%), French American Indian (55.8%, a difference of 0.14%), Barbadian (56.0%, a difference of 0.20%), Marshallese (55.8%, a difference of 0.25%), and Osage (55.8%, a difference of 0.26%).
| Demographics | Rating | Rank | College, 1 year or more |
| Immigrants | Bangladesh | 2.6 /100 | #232 | Tragic 56.6% |
| Immigrants | Nonimmigrants | 2.5 /100 | #233 | Tragic 56.5% |
| Spanish Americans | 1.8 /100 | #234 | Tragic 56.3% |
| West Indians | 1.8 /100 | #235 | Tragic 56.3% |
| Iroquois | 1.7 /100 | #236 | Tragic 56.2% |
| Samoans | 1.6 /100 | #237 | Tragic 56.2% |
| Barbadians | 1.3 /100 | #238 | Tragic 56.0% |
| Puget Sound Salish | 1.1 /100 | #239 | Tragic 55.9% |
| Trinidadians and Tobagonians | 1.1 /100 | #240 | Tragic 55.8% |
| French American Indians | 1.0 /100 | #241 | Tragic 55.8% |
| Marshallese | 1.0 /100 | #242 | Tragic 55.8% |
| Osage | 1.0 /100 | #243 | Tragic 55.8% |
| Chippewa | 0.9 /100 | #244 | Tragic 55.7% |
| Immigrants | Liberia | 0.8 /100 | #245 | Tragic 55.7% |
| Malaysians | 0.8 /100 | #246 | Tragic 55.6% |