Immigrants from Northern Europe vs Puget Sound Salish College, 1 year or more
COMPARE
Immigrants from Northern Europe
Puget Sound Salish
College, 1 year or more
College, 1 year or more Comparison
Immigrants from Northern Europe
Puget Sound Salish
65.6%
COLLEGE, 1 YEAR OR MORE
100.0/ 100
METRIC RATING
29th/ 347
METRIC RANK
55.9%
COLLEGE, 1 YEAR OR MORE
1.1/ 100
METRIC RATING
239th/ 347
METRIC RANK
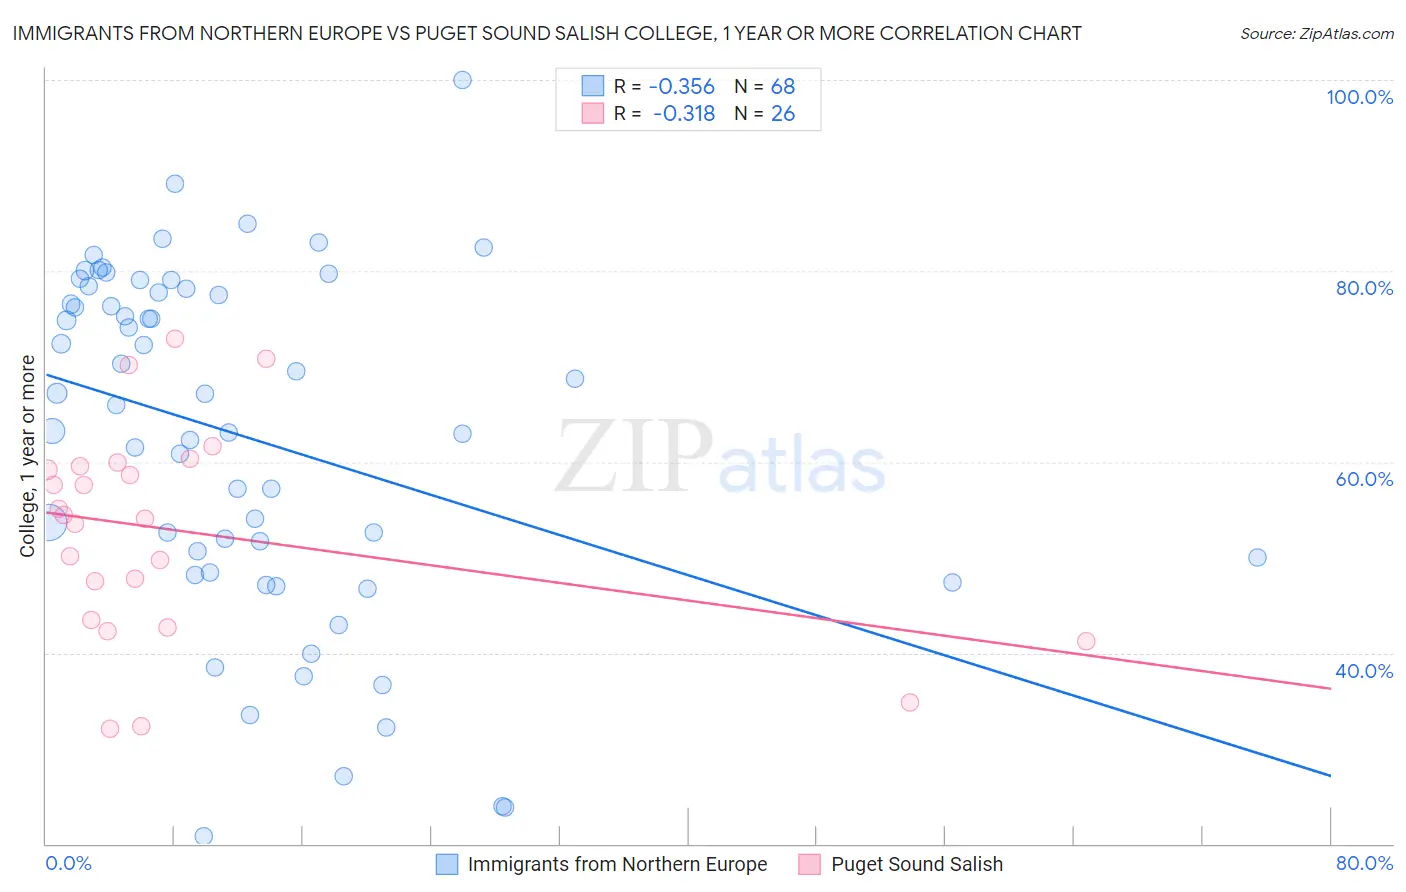
Immigrants from Northern Europe vs Puget Sound Salish College, 1 year or more Correlation Chart
The statistical analysis conducted on geographies consisting of 477,221,622 people shows a mild negative correlation between the proportion of Immigrants from Northern Europe and percentage of population with at least college, 1 year or more education in the United States with a correlation coefficient (R) of -0.356 and weighted average of 65.6%. Similarly, the statistical analysis conducted on geographies consisting of 46,155,865 people shows a mild negative correlation between the proportion of Puget Sound Salish and percentage of population with at least college, 1 year or more education in the United States with a correlation coefficient (R) of -0.318 and weighted average of 55.9%, a difference of 17.4%.
College, 1 year or more Correlation Summary
| Measurement | Immigrants from Northern Europe | Puget Sound Salish |
| Minimum | 20.8% | 32.1% |
| Maximum | 100.0% | 72.9% |
| Range | 79.2% | 40.8% |
| Mean | 62.6% | 52.7% |
| Median | 66.5% | 54.3% |
| Interquartile 25% (IQ1) | 49.2% | 43.4% |
| Interquartile 75% (IQ3) | 77.9% | 59.6% |
| Interquartile Range (IQR) | 28.7% | 16.2% |
| Standard Deviation (Sample) | 18.2% | 11.1% |
| Standard Deviation (Population) | 18.0% | 10.9% |
Similar Demographics by College, 1 year or more
Demographics Similar to Immigrants from Northern Europe by College, 1 year or more
In terms of college, 1 year or more, the demographic groups most similar to Immigrants from Northern Europe are Immigrants from Denmark (65.6%, a difference of 0.11%), Turkish (65.5%, a difference of 0.19%), Bulgarian (65.5%, a difference of 0.24%), Immigrants from France (65.8%, a difference of 0.25%), and Immigrants from Sri Lanka (65.4%, a difference of 0.39%).
| Demographics | Rating | Rank | College, 1 year or more |
| Soviet Union | 100.0 /100 | #22 | Exceptional 66.4% |
| Immigrants | China | 100.0 /100 | #23 | Exceptional 66.4% |
| Immigrants | Belgium | 100.0 /100 | #24 | Exceptional 66.3% |
| Indians (Asian) | 100.0 /100 | #25 | Exceptional 66.1% |
| Latvians | 100.0 /100 | #26 | Exceptional 66.1% |
| Immigrants | Ireland | 100.0 /100 | #27 | Exceptional 65.9% |
| Immigrants | France | 100.0 /100 | #28 | Exceptional 65.8% |
| Immigrants | Northern Europe | 100.0 /100 | #29 | Exceptional 65.6% |
| Immigrants | Denmark | 100.0 /100 | #30 | Exceptional 65.6% |
| Turks | 100.0 /100 | #31 | Exceptional 65.5% |
| Bulgarians | 100.0 /100 | #32 | Exceptional 65.5% |
| Immigrants | Sri Lanka | 99.9 /100 | #33 | Exceptional 65.4% |
| Israelis | 99.9 /100 | #34 | Exceptional 65.3% |
| Immigrants | Turkey | 99.9 /100 | #35 | Exceptional 65.2% |
| Immigrants | South Africa | 99.9 /100 | #36 | Exceptional 65.1% |
Demographics Similar to Puget Sound Salish by College, 1 year or more
In terms of college, 1 year or more, the demographic groups most similar to Puget Sound Salish are Trinidadian and Tobagonian (55.8%, a difference of 0.090%), French American Indian (55.8%, a difference of 0.14%), Barbadian (56.0%, a difference of 0.20%), Marshallese (55.8%, a difference of 0.25%), and Osage (55.8%, a difference of 0.26%).
| Demographics | Rating | Rank | College, 1 year or more |
| Immigrants | Bangladesh | 2.6 /100 | #232 | Tragic 56.6% |
| Immigrants | Nonimmigrants | 2.5 /100 | #233 | Tragic 56.5% |
| Spanish Americans | 1.8 /100 | #234 | Tragic 56.3% |
| West Indians | 1.8 /100 | #235 | Tragic 56.3% |
| Iroquois | 1.7 /100 | #236 | Tragic 56.2% |
| Samoans | 1.6 /100 | #237 | Tragic 56.2% |
| Barbadians | 1.3 /100 | #238 | Tragic 56.0% |
| Puget Sound Salish | 1.1 /100 | #239 | Tragic 55.9% |
| Trinidadians and Tobagonians | 1.1 /100 | #240 | Tragic 55.8% |
| French American Indians | 1.0 /100 | #241 | Tragic 55.8% |
| Marshallese | 1.0 /100 | #242 | Tragic 55.8% |
| Osage | 1.0 /100 | #243 | Tragic 55.8% |
| Chippewa | 0.9 /100 | #244 | Tragic 55.7% |
| Immigrants | Liberia | 0.8 /100 | #245 | Tragic 55.7% |
| Malaysians | 0.8 /100 | #246 | Tragic 55.6% |