Portuguese vs Immigrants from Fiji 7th Grade
COMPARE
Portuguese
Immigrants from Fiji
7th Grade
7th Grade Comparison
Portuguese
Immigrants from Fiji
95.8%
7TH GRADE
13.6/ 100
METRIC RATING
211th/ 347
METRIC RANK
93.5%
7TH GRADE
0.0/ 100
METRIC RATING
320th/ 347
METRIC RANK
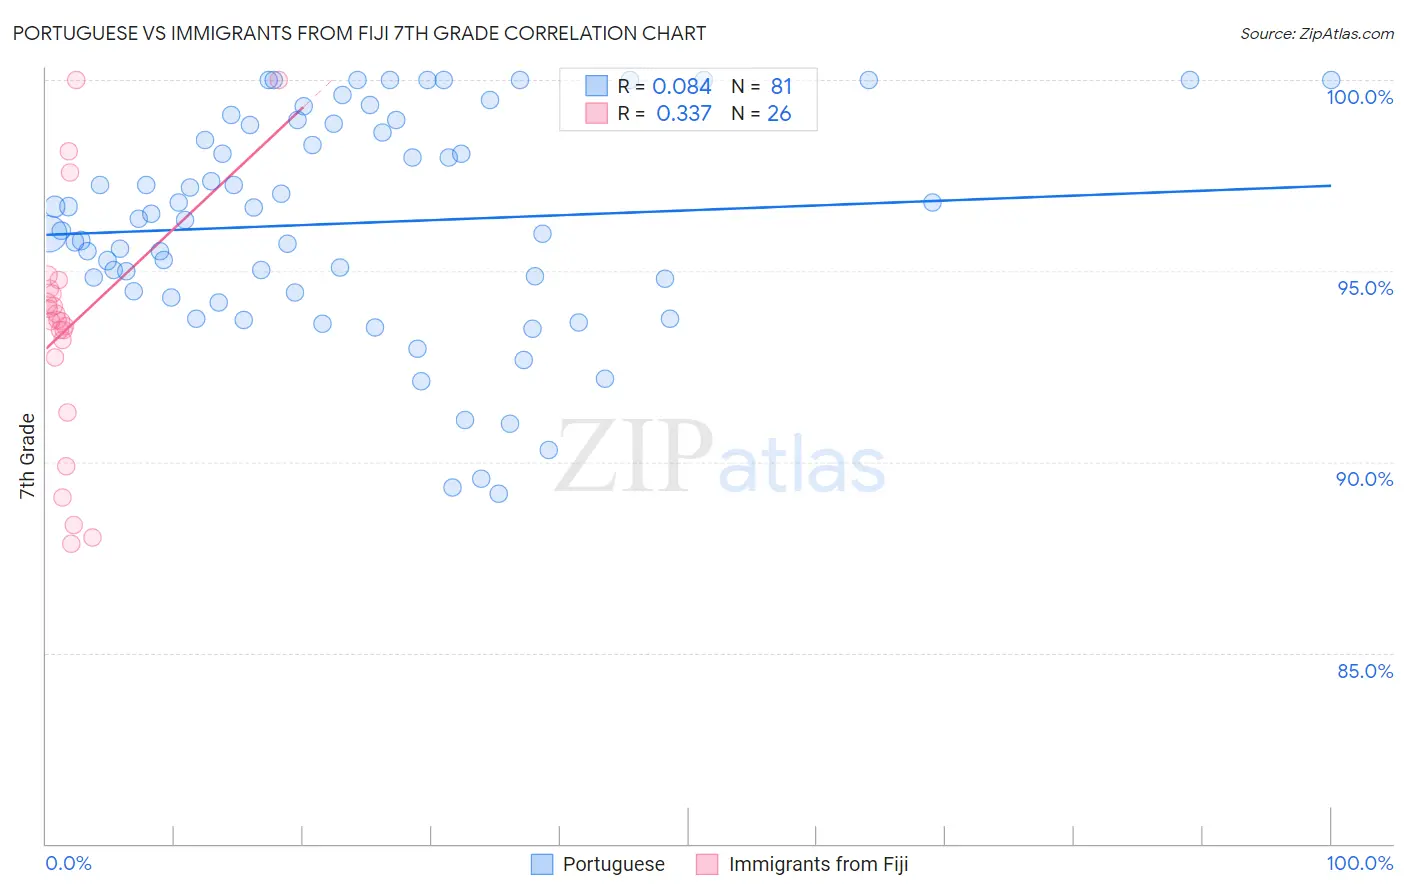
Portuguese vs Immigrants from Fiji 7th Grade Correlation Chart
The statistical analysis conducted on geographies consisting of 450,343,001 people shows a slight positive correlation between the proportion of Portuguese and percentage of population with at least 7th grade education in the United States with a correlation coefficient (R) of 0.084 and weighted average of 95.8%. Similarly, the statistical analysis conducted on geographies consisting of 93,756,204 people shows a mild positive correlation between the proportion of Immigrants from Fiji and percentage of population with at least 7th grade education in the United States with a correlation coefficient (R) of 0.337 and weighted average of 93.5%, a difference of 2.4%.
7th Grade Correlation Summary
| Measurement | Portuguese | Immigrants from Fiji |
| Minimum | 89.2% | 87.9% |
| Maximum | 100.0% | 100.0% |
| Range | 10.8% | 12.1% |
| Mean | 96.3% | 93.6% |
| Median | 96.4% | 93.7% |
| Interquartile 25% (IQ1) | 94.5% | 92.7% |
| Interquartile 75% (IQ3) | 98.8% | 94.5% |
| Interquartile Range (IQR) | 4.4% | 1.8% |
| Standard Deviation (Sample) | 2.8% | 3.2% |
| Standard Deviation (Population) | 2.8% | 3.1% |
Similar Demographics by 7th Grade
Demographics Similar to Portuguese by 7th Grade
In terms of 7th grade, the demographic groups most similar to Portuguese are Immigrants from Lebanon (95.8%, a difference of 0.010%), Immigrants from Morocco (95.8%, a difference of 0.010%), Dutch West Indian (95.8%, a difference of 0.030%), Hawaiian (95.8%, a difference of 0.030%), and Bahamian (95.7%, a difference of 0.030%).
| Demographics | Rating | Rank | 7th Grade |
| Assyrians/Chaldeans/Syriacs | 20.5 /100 | #204 | Fair 95.8% |
| Moroccans | 18.9 /100 | #205 | Poor 95.8% |
| Africans | 17.6 /100 | #206 | Poor 95.8% |
| Navajo | 17.0 /100 | #207 | Poor 95.8% |
| Immigrants | Sudan | 17.0 /100 | #208 | Poor 95.8% |
| Dutch West Indians | 16.1 /100 | #209 | Poor 95.8% |
| Hawaiians | 16.0 /100 | #210 | Poor 95.8% |
| Portuguese | 13.6 /100 | #211 | Poor 95.8% |
| Immigrants | Lebanon | 13.0 /100 | #212 | Poor 95.8% |
| Immigrants | Morocco | 12.6 /100 | #213 | Poor 95.8% |
| Bahamians | 11.6 /100 | #214 | Poor 95.7% |
| Spanish Americans | 9.3 /100 | #215 | Tragic 95.7% |
| Immigrants | Chile | 9.1 /100 | #216 | Tragic 95.7% |
| Immigrants | Pakistan | 9.0 /100 | #217 | Tragic 95.7% |
| Immigrants | Liberia | 8.1 /100 | #218 | Tragic 95.7% |
Demographics Similar to Immigrants from Fiji by 7th Grade
In terms of 7th grade, the demographic groups most similar to Immigrants from Fiji are Belizean (93.5%, a difference of 0.040%), Nicaraguan (93.5%, a difference of 0.080%), Immigrants from Cambodia (93.7%, a difference of 0.17%), Immigrants from Belize (93.4%, a difference of 0.19%), and Dominican (93.3%, a difference of 0.20%).
| Demographics | Rating | Rank | 7th Grade |
| Immigrants | Bangladesh | 0.0 /100 | #313 | Tragic 94.0% |
| Japanese | 0.0 /100 | #314 | Tragic 94.0% |
| Vietnamese | 0.0 /100 | #315 | Tragic 93.9% |
| Immigrants | Vietnam | 0.0 /100 | #316 | Tragic 93.9% |
| Immigrants | Cuba | 0.0 /100 | #317 | Tragic 93.8% |
| Immigrants | Ecuador | 0.0 /100 | #318 | Tragic 93.7% |
| Immigrants | Cambodia | 0.0 /100 | #319 | Tragic 93.7% |
| Immigrants | Fiji | 0.0 /100 | #320 | Tragic 93.5% |
| Belizeans | 0.0 /100 | #321 | Tragic 93.5% |
| Nicaraguans | 0.0 /100 | #322 | Tragic 93.5% |
| Immigrants | Belize | 0.0 /100 | #323 | Tragic 93.4% |
| Dominicans | 0.0 /100 | #324 | Tragic 93.3% |
| Central American Indians | 0.0 /100 | #325 | Tragic 93.3% |
| Nepalese | 0.0 /100 | #326 | Tragic 93.2% |
| Immigrants | Cabo Verde | 0.0 /100 | #327 | Tragic 93.1% |