Portuguese vs Immigrants from Fiji In Labor Force | Age 45-54
COMPARE
Portuguese
Immigrants from Fiji
In Labor Force | Age 45-54
In Labor Force | Age 45-54 Comparison
Portuguese
Immigrants from Fiji
82.2%
IN LABOR FORCE | AGE 45-54
4.7/ 100
METRIC RATING
217th/ 347
METRIC RANK
81.5%
IN LABOR FORCE | AGE 45-54
0.1/ 100
METRIC RATING
258th/ 347
METRIC RANK
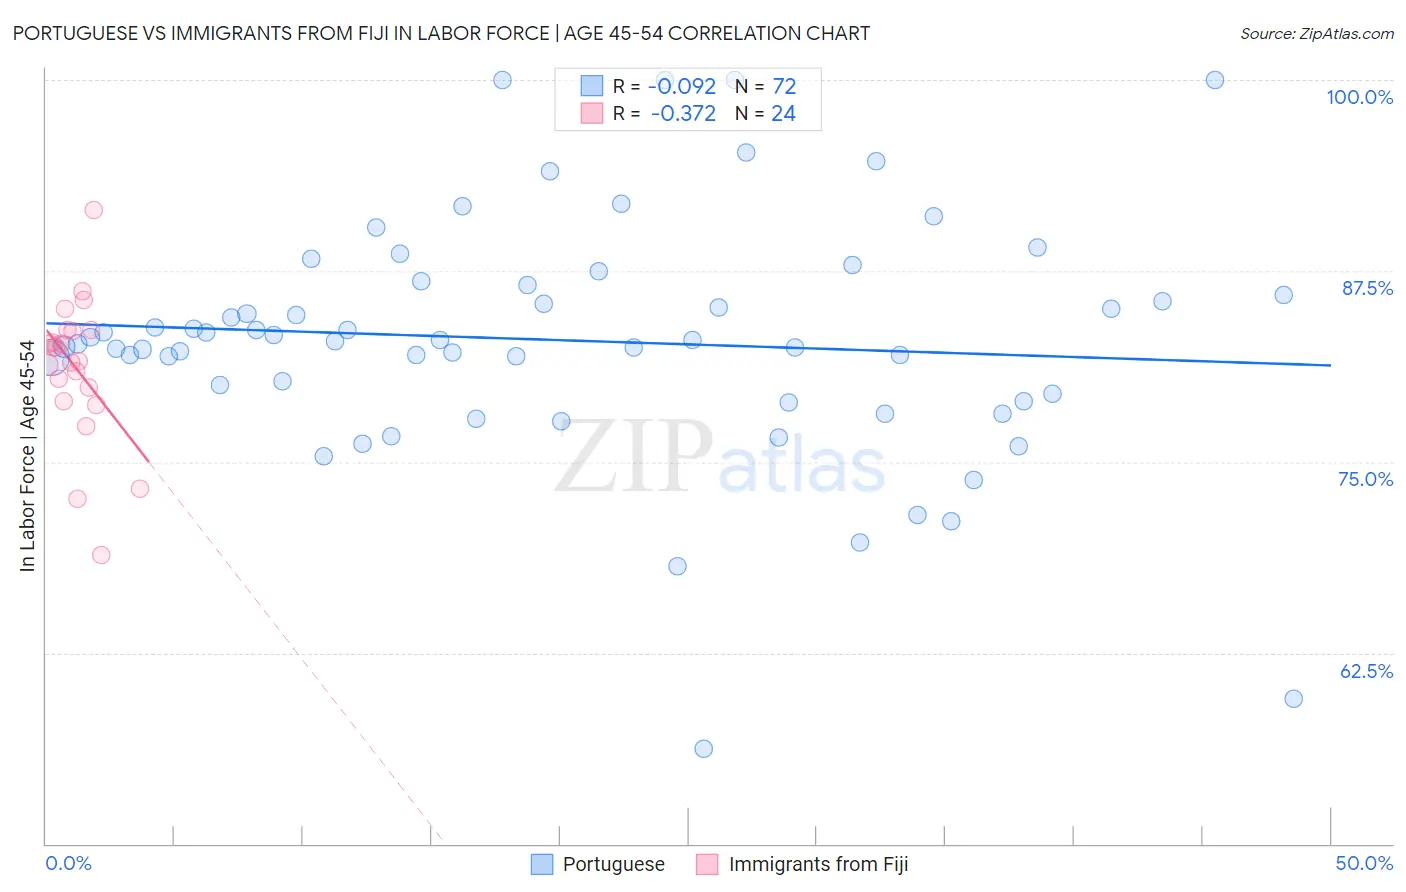
Portuguese vs Immigrants from Fiji In Labor Force | Age 45-54 Correlation Chart
The statistical analysis conducted on geographies consisting of 449,955,919 people shows a slight negative correlation between the proportion of Portuguese and labor force participation rate among population between the ages 45 and 54 in the United States with a correlation coefficient (R) of -0.092 and weighted average of 82.2%. Similarly, the statistical analysis conducted on geographies consisting of 93,754,712 people shows a mild negative correlation between the proportion of Immigrants from Fiji and labor force participation rate among population between the ages 45 and 54 in the United States with a correlation coefficient (R) of -0.372 and weighted average of 81.5%, a difference of 0.83%.
In Labor Force | Age 45-54 Correlation Summary
| Measurement | Portuguese | Immigrants from Fiji |
| Minimum | 56.2% | 68.9% |
| Maximum | 100.0% | 91.5% |
| Range | 43.8% | 22.6% |
| Mean | 83.0% | 81.2% |
| Median | 82.9% | 82.0% |
| Interquartile 25% (IQ1) | 79.2% | 79.5% |
| Interquartile 75% (IQ3) | 86.2% | 83.6% |
| Interquartile Range (IQR) | 7.0% | 4.1% |
| Standard Deviation (Sample) | 7.9% | 4.7% |
| Standard Deviation (Population) | 7.9% | 4.6% |
Similar Demographics by In Labor Force | Age 45-54
Demographics Similar to Portuguese by In Labor Force | Age 45-54
In terms of in labor force | age 45-54, the demographic groups most similar to Portuguese are English (82.2%, a difference of 0.020%), Scottish (82.2%, a difference of 0.030%), French (82.2%, a difference of 0.030%), Immigrants from Panama (82.2%, a difference of 0.040%), and Iraqi (82.2%, a difference of 0.040%).
| Demographics | Rating | Rank | In Labor Force | Age 45-54 |
| Immigrants | Bahamas | 7.1 /100 | #210 | Tragic 82.3% |
| Immigrants | Syria | 6.6 /100 | #211 | Tragic 82.3% |
| Ecuadorians | 6.3 /100 | #212 | Tragic 82.3% |
| Immigrants | Uzbekistan | 5.8 /100 | #213 | Tragic 82.3% |
| Immigrants | Panama | 5.6 /100 | #214 | Tragic 82.2% |
| Iraqis | 5.6 /100 | #215 | Tragic 82.2% |
| Scottish | 5.3 /100 | #216 | Tragic 82.2% |
| Portuguese | 4.7 /100 | #217 | Tragic 82.2% |
| English | 4.4 /100 | #218 | Tragic 82.2% |
| French | 4.1 /100 | #219 | Tragic 82.2% |
| Bahamians | 3.6 /100 | #220 | Tragic 82.2% |
| Panamanians | 3.5 /100 | #221 | Tragic 82.2% |
| Immigrants | Ecuador | 3.4 /100 | #222 | Tragic 82.2% |
| Immigrants | Immigrants | 3.1 /100 | #223 | Tragic 82.1% |
| Immigrants | Jamaica | 2.7 /100 | #224 | Tragic 82.1% |
Demographics Similar to Immigrants from Fiji by In Labor Force | Age 45-54
In terms of in labor force | age 45-54, the demographic groups most similar to Immigrants from Fiji are Immigrants from Congo (81.6%, a difference of 0.010%), Guyanese (81.5%, a difference of 0.010%), Barbadian (81.6%, a difference of 0.030%), Spaniard (81.5%, a difference of 0.030%), and Hawaiian (81.5%, a difference of 0.050%).
| Demographics | Rating | Rank | In Labor Force | Age 45-54 |
| Guamanians/Chamorros | 0.2 /100 | #251 | Tragic 81.6% |
| Pennsylvania Germans | 0.2 /100 | #252 | Tragic 81.6% |
| Japanese | 0.2 /100 | #253 | Tragic 81.6% |
| Immigrants | Laos | 0.2 /100 | #254 | Tragic 81.6% |
| Scotch-Irish | 0.2 /100 | #255 | Tragic 81.6% |
| Barbadians | 0.1 /100 | #256 | Tragic 81.6% |
| Immigrants | Congo | 0.1 /100 | #257 | Tragic 81.6% |
| Immigrants | Fiji | 0.1 /100 | #258 | Tragic 81.5% |
| Guyanese | 0.1 /100 | #259 | Tragic 81.5% |
| Spaniards | 0.1 /100 | #260 | Tragic 81.5% |
| Hawaiians | 0.1 /100 | #261 | Tragic 81.5% |
| Immigrants | Guyana | 0.1 /100 | #262 | Tragic 81.5% |
| Indonesians | 0.1 /100 | #263 | Tragic 81.5% |
| Immigrants | West Indies | 0.1 /100 | #264 | Tragic 81.5% |
| Hondurans | 0.1 /100 | #265 | Tragic 81.4% |