Iranian vs Immigrants from Fiji 7th Grade
COMPARE
Iranian
Immigrants from Fiji
7th Grade
7th Grade Comparison
Iranians
Immigrants from Fiji
96.8%
7TH GRADE
99.6/ 100
METRIC RATING
69th/ 347
METRIC RANK
93.5%
7TH GRADE
0.0/ 100
METRIC RATING
320th/ 347
METRIC RANK
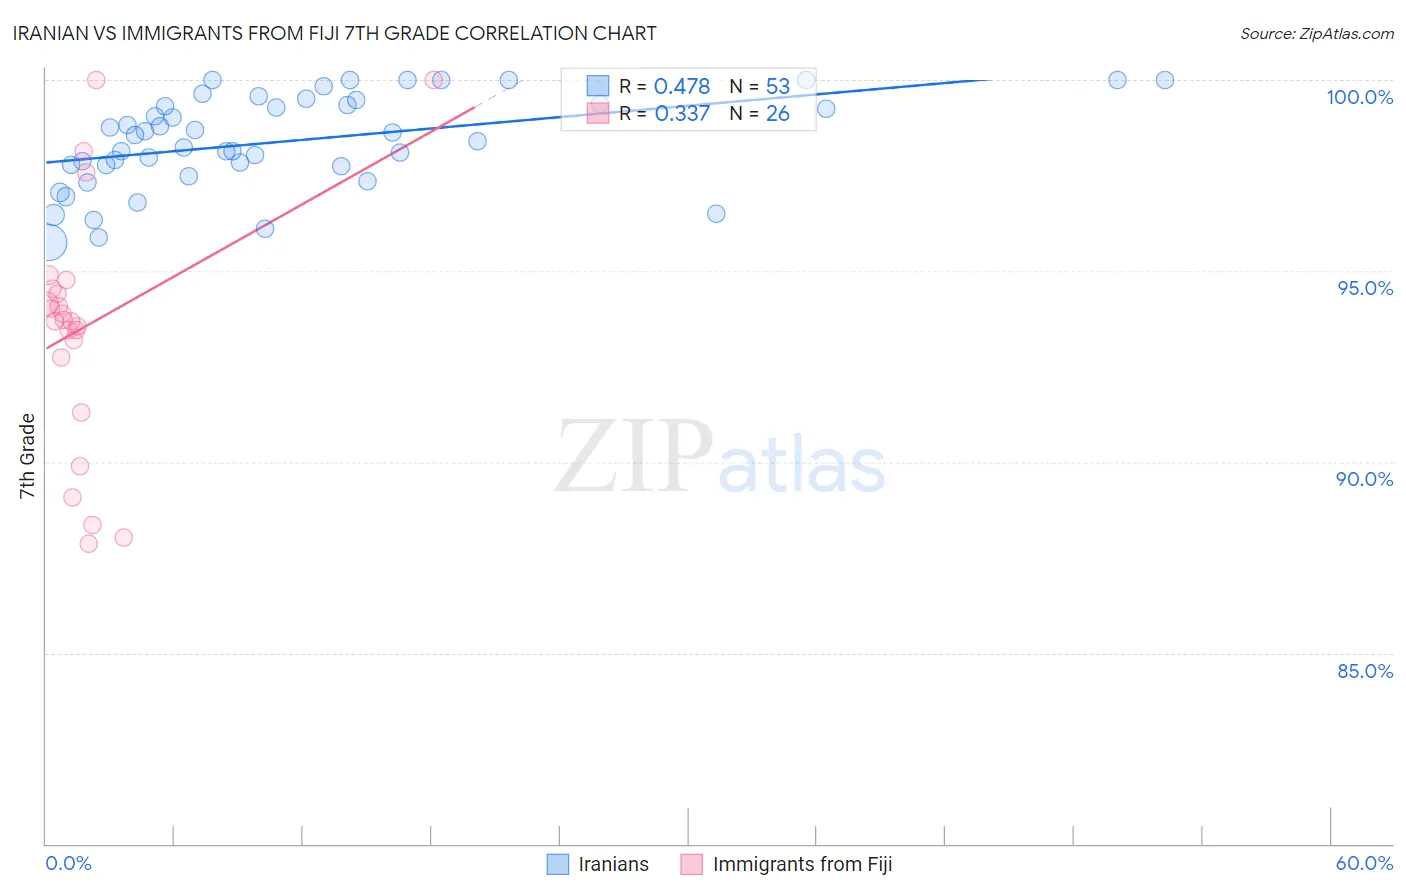
Iranian vs Immigrants from Fiji 7th Grade Correlation Chart
The statistical analysis conducted on geographies consisting of 310,636,461 people shows a moderate positive correlation between the proportion of Iranians and percentage of population with at least 7th grade education in the United States with a correlation coefficient (R) of 0.478 and weighted average of 96.8%. Similarly, the statistical analysis conducted on geographies consisting of 93,756,204 people shows a mild positive correlation between the proportion of Immigrants from Fiji and percentage of population with at least 7th grade education in the United States with a correlation coefficient (R) of 0.337 and weighted average of 93.5%, a difference of 3.5%.
7th Grade Correlation Summary
| Measurement | Iranian | Immigrants from Fiji |
| Minimum | 95.7% | 87.9% |
| Maximum | 100.0% | 100.0% |
| Range | 4.3% | 12.1% |
| Mean | 98.4% | 93.6% |
| Median | 98.6% | 93.7% |
| Interquartile 25% (IQ1) | 97.8% | 92.7% |
| Interquartile 75% (IQ3) | 99.4% | 94.5% |
| Interquartile Range (IQR) | 1.7% | 1.8% |
| Standard Deviation (Sample) | 1.2% | 3.2% |
| Standard Deviation (Population) | 1.2% | 3.1% |
Similar Demographics by 7th Grade
Demographics Similar to Iranians by 7th Grade
In terms of 7th grade, the demographic groups most similar to Iranians are New Zealander (96.8%, a difference of 0.0%), Immigrants from Lithuania (96.8%, a difference of 0.010%), Immigrants from India (96.9%, a difference of 0.020%), Cajun (96.8%, a difference of 0.020%), and Arapaho (96.8%, a difference of 0.030%).
| Demographics | Rating | Rank | 7th Grade |
| Immigrants | North America | 99.8 /100 | #62 | Exceptional 96.9% |
| Immigrants | Northern Europe | 99.7 /100 | #63 | Exceptional 96.9% |
| Immigrants | Austria | 99.7 /100 | #64 | Exceptional 96.9% |
| Canadians | 99.7 /100 | #65 | Exceptional 96.9% |
| Ukrainians | 99.7 /100 | #66 | Exceptional 96.9% |
| Native Hawaiians | 99.7 /100 | #67 | Exceptional 96.9% |
| Immigrants | India | 99.6 /100 | #68 | Exceptional 96.9% |
| Iranians | 99.6 /100 | #69 | Exceptional 96.8% |
| New Zealanders | 99.6 /100 | #70 | Exceptional 96.8% |
| Immigrants | Lithuania | 99.6 /100 | #71 | Exceptional 96.8% |
| Cajuns | 99.5 /100 | #72 | Exceptional 96.8% |
| Arapaho | 99.5 /100 | #73 | Exceptional 96.8% |
| Immigrants | England | 99.5 /100 | #74 | Exceptional 96.8% |
| Zimbabweans | 99.5 /100 | #75 | Exceptional 96.8% |
| Immigrants | Ireland | 99.4 /100 | #76 | Exceptional 96.8% |
Demographics Similar to Immigrants from Fiji by 7th Grade
In terms of 7th grade, the demographic groups most similar to Immigrants from Fiji are Belizean (93.5%, a difference of 0.040%), Nicaraguan (93.5%, a difference of 0.080%), Immigrants from Cambodia (93.7%, a difference of 0.17%), Immigrants from Belize (93.4%, a difference of 0.19%), and Dominican (93.3%, a difference of 0.20%).
| Demographics | Rating | Rank | 7th Grade |
| Immigrants | Bangladesh | 0.0 /100 | #313 | Tragic 94.0% |
| Japanese | 0.0 /100 | #314 | Tragic 94.0% |
| Vietnamese | 0.0 /100 | #315 | Tragic 93.9% |
| Immigrants | Vietnam | 0.0 /100 | #316 | Tragic 93.9% |
| Immigrants | Cuba | 0.0 /100 | #317 | Tragic 93.8% |
| Immigrants | Ecuador | 0.0 /100 | #318 | Tragic 93.7% |
| Immigrants | Cambodia | 0.0 /100 | #319 | Tragic 93.7% |
| Immigrants | Fiji | 0.0 /100 | #320 | Tragic 93.5% |
| Belizeans | 0.0 /100 | #321 | Tragic 93.5% |
| Nicaraguans | 0.0 /100 | #322 | Tragic 93.5% |
| Immigrants | Belize | 0.0 /100 | #323 | Tragic 93.4% |
| Dominicans | 0.0 /100 | #324 | Tragic 93.3% |
| Central American Indians | 0.0 /100 | #325 | Tragic 93.3% |
| Nepalese | 0.0 /100 | #326 | Tragic 93.2% |
| Immigrants | Cabo Verde | 0.0 /100 | #327 | Tragic 93.1% |