Portuguese vs Immigrants from Grenada 7th Grade
COMPARE
Portuguese
Immigrants from Grenada
7th Grade
7th Grade Comparison
Portuguese
Immigrants from Grenada
95.8%
7TH GRADE
13.6/ 100
METRIC RATING
211th/ 347
METRIC RANK
94.8%
7TH GRADE
0.0/ 100
METRIC RATING
291st/ 347
METRIC RANK
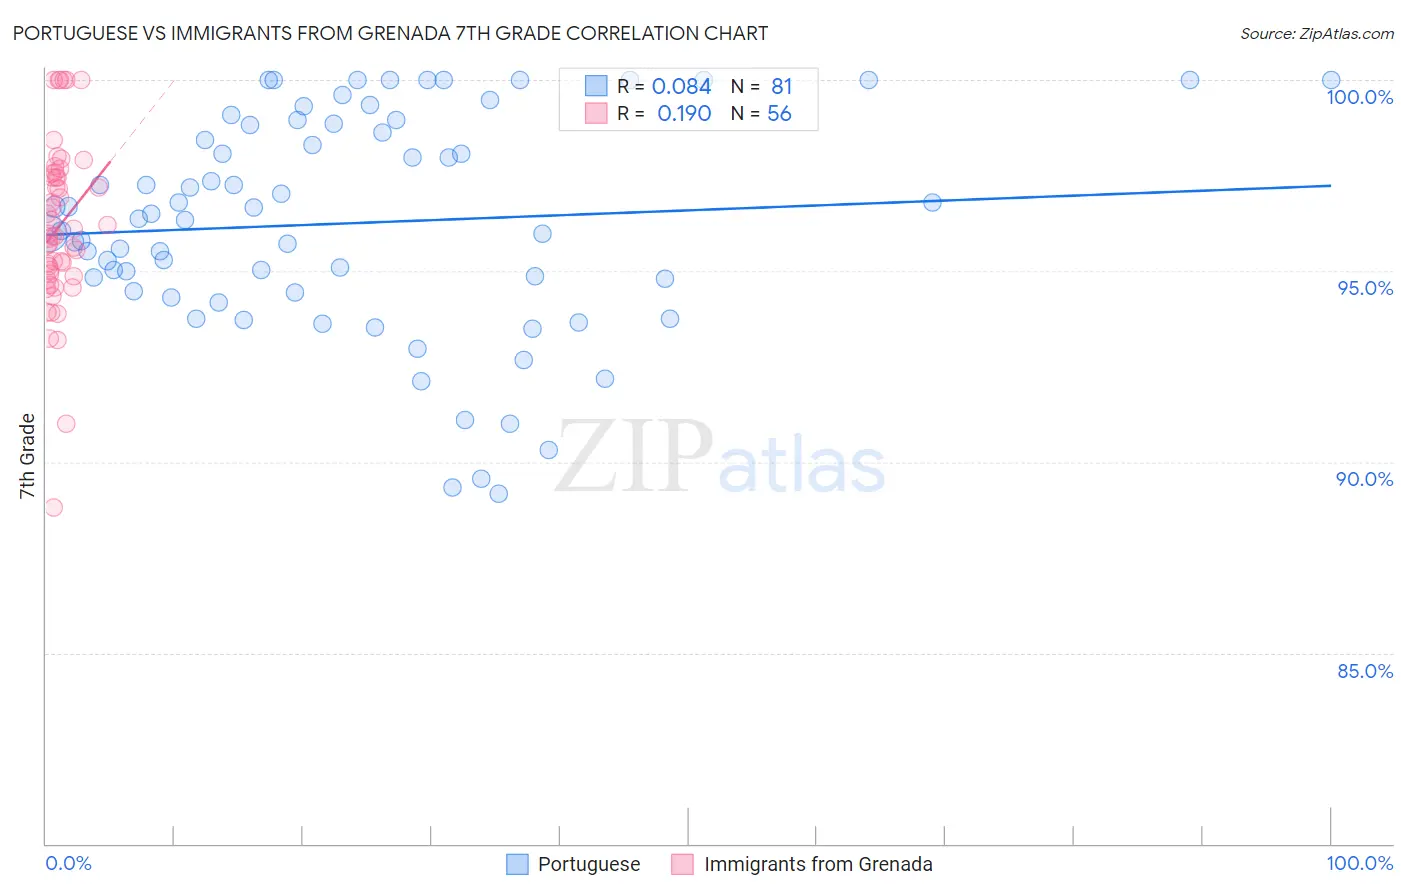
Portuguese vs Immigrants from Grenada 7th Grade Correlation Chart
The statistical analysis conducted on geographies consisting of 450,343,001 people shows a slight positive correlation between the proportion of Portuguese and percentage of population with at least 7th grade education in the United States with a correlation coefficient (R) of 0.084 and weighted average of 95.8%. Similarly, the statistical analysis conducted on geographies consisting of 67,191,509 people shows a poor positive correlation between the proportion of Immigrants from Grenada and percentage of population with at least 7th grade education in the United States with a correlation coefficient (R) of 0.190 and weighted average of 94.8%, a difference of 1.0%.
7th Grade Correlation Summary
| Measurement | Portuguese | Immigrants from Grenada |
| Minimum | 89.2% | 88.8% |
| Maximum | 100.0% | 100.0% |
| Range | 10.8% | 11.2% |
| Mean | 96.3% | 96.2% |
| Median | 96.4% | 95.9% |
| Interquartile 25% (IQ1) | 94.5% | 94.9% |
| Interquartile 75% (IQ3) | 98.8% | 97.5% |
| Interquartile Range (IQR) | 4.4% | 2.6% |
| Standard Deviation (Sample) | 2.8% | 2.2% |
| Standard Deviation (Population) | 2.8% | 2.2% |
Similar Demographics by 7th Grade
Demographics Similar to Portuguese by 7th Grade
In terms of 7th grade, the demographic groups most similar to Portuguese are Immigrants from Lebanon (95.8%, a difference of 0.010%), Immigrants from Morocco (95.8%, a difference of 0.010%), Dutch West Indian (95.8%, a difference of 0.030%), Hawaiian (95.8%, a difference of 0.030%), and Bahamian (95.7%, a difference of 0.030%).
| Demographics | Rating | Rank | 7th Grade |
| Assyrians/Chaldeans/Syriacs | 20.5 /100 | #204 | Fair 95.8% |
| Moroccans | 18.9 /100 | #205 | Poor 95.8% |
| Africans | 17.6 /100 | #206 | Poor 95.8% |
| Navajo | 17.0 /100 | #207 | Poor 95.8% |
| Immigrants | Sudan | 17.0 /100 | #208 | Poor 95.8% |
| Dutch West Indians | 16.1 /100 | #209 | Poor 95.8% |
| Hawaiians | 16.0 /100 | #210 | Poor 95.8% |
| Portuguese | 13.6 /100 | #211 | Poor 95.8% |
| Immigrants | Lebanon | 13.0 /100 | #212 | Poor 95.8% |
| Immigrants | Morocco | 12.6 /100 | #213 | Poor 95.8% |
| Bahamians | 11.6 /100 | #214 | Poor 95.7% |
| Spanish Americans | 9.3 /100 | #215 | Tragic 95.7% |
| Immigrants | Chile | 9.1 /100 | #216 | Tragic 95.7% |
| Immigrants | Pakistan | 9.0 /100 | #217 | Tragic 95.7% |
| Immigrants | Liberia | 8.1 /100 | #218 | Tragic 95.7% |
Demographics Similar to Immigrants from Grenada by 7th Grade
In terms of 7th grade, the demographic groups most similar to Immigrants from Grenada are Immigrants from West Indies (94.8%, a difference of 0.020%), Malaysian (94.8%, a difference of 0.040%), Fijian (94.7%, a difference of 0.040%), Taiwanese (94.8%, a difference of 0.060%), and British West Indian (94.8%, a difference of 0.070%).
| Demographics | Rating | Rank | 7th Grade |
| Armenians | 0.1 /100 | #284 | Tragic 95.0% |
| Immigrants | Eritrea | 0.1 /100 | #285 | Tragic 94.9% |
| Immigrants | Philippines | 0.0 /100 | #286 | Tragic 94.9% |
| Immigrants | Peru | 0.0 /100 | #287 | Tragic 94.9% |
| British West Indians | 0.0 /100 | #288 | Tragic 94.8% |
| Taiwanese | 0.0 /100 | #289 | Tragic 94.8% |
| Malaysians | 0.0 /100 | #290 | Tragic 94.8% |
| Immigrants | Grenada | 0.0 /100 | #291 | Tragic 94.8% |
| Immigrants | West Indies | 0.0 /100 | #292 | Tragic 94.8% |
| Fijians | 0.0 /100 | #293 | Tragic 94.7% |
| Haitians | 0.0 /100 | #294 | Tragic 94.7% |
| Yaqui | 0.0 /100 | #295 | Tragic 94.6% |
| Cubans | 0.0 /100 | #296 | Tragic 94.6% |
| Immigrants | South Eastern Asia | 0.0 /100 | #297 | Tragic 94.5% |
| Indonesians | 0.0 /100 | #298 | Tragic 94.5% |