Immigrants from Greece vs Immigrants from Fiji 7th Grade
COMPARE
Immigrants from Greece
Immigrants from Fiji
7th Grade
7th Grade Comparison
Immigrants from Greece
Immigrants from Fiji
96.3%
7TH GRADE
85.9/ 100
METRIC RATING
144th/ 347
METRIC RANK
93.5%
7TH GRADE
0.0/ 100
METRIC RATING
320th/ 347
METRIC RANK
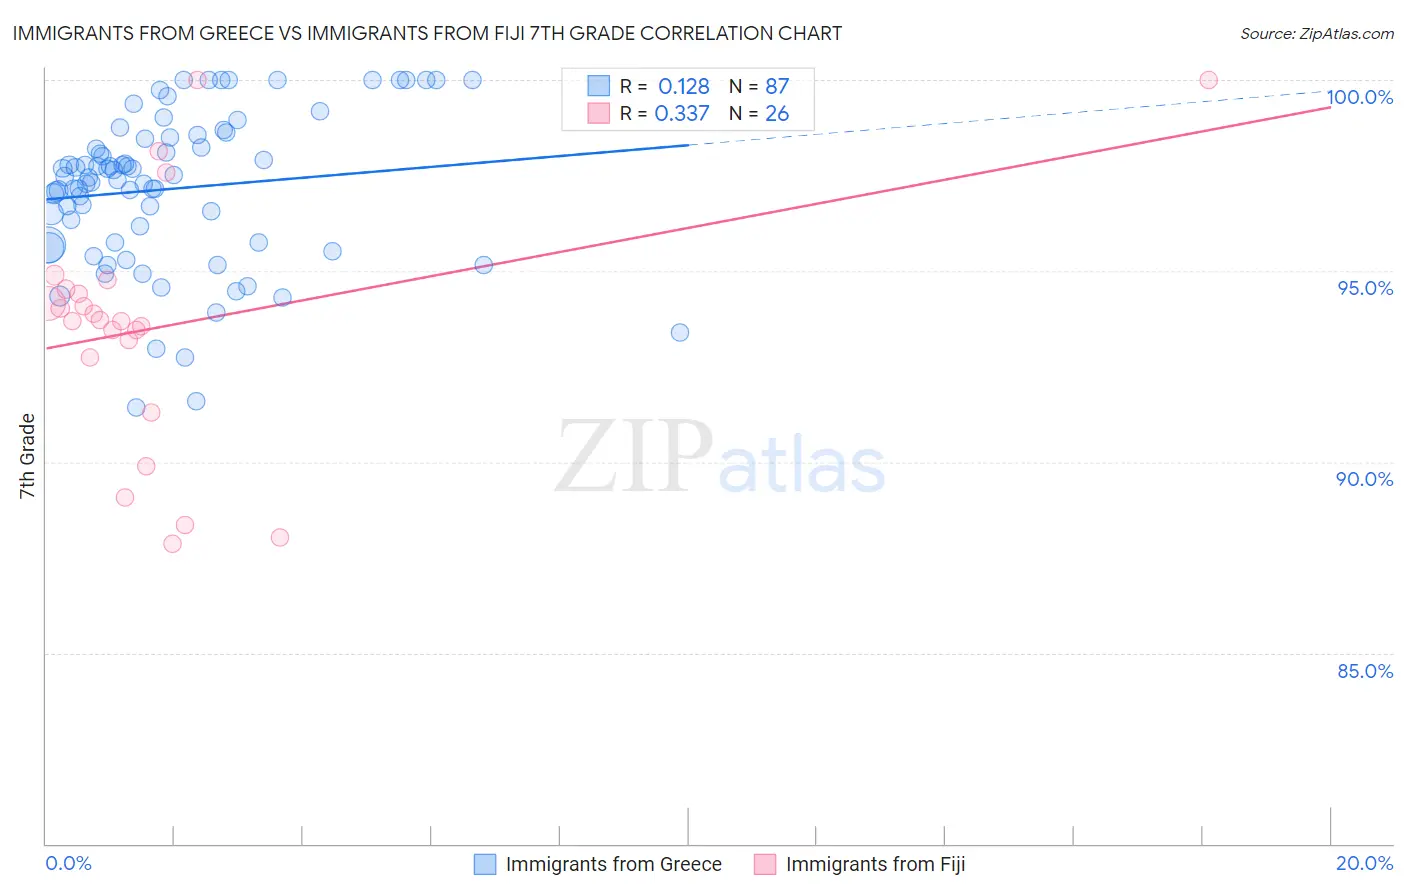
Immigrants from Greece vs Immigrants from Fiji 7th Grade Correlation Chart
The statistical analysis conducted on geographies consisting of 216,879,847 people shows a poor positive correlation between the proportion of Immigrants from Greece and percentage of population with at least 7th grade education in the United States with a correlation coefficient (R) of 0.128 and weighted average of 96.3%. Similarly, the statistical analysis conducted on geographies consisting of 93,756,204 people shows a mild positive correlation between the proportion of Immigrants from Fiji and percentage of population with at least 7th grade education in the United States with a correlation coefficient (R) of 0.337 and weighted average of 93.5%, a difference of 3.0%.
7th Grade Correlation Summary
| Measurement | Immigrants from Greece | Immigrants from Fiji |
| Minimum | 91.4% | 87.9% |
| Maximum | 100.0% | 100.0% |
| Range | 8.6% | 12.1% |
| Mean | 97.2% | 93.6% |
| Median | 97.4% | 93.7% |
| Interquartile 25% (IQ1) | 95.7% | 92.7% |
| Interquartile 75% (IQ3) | 98.5% | 94.5% |
| Interquartile Range (IQR) | 2.8% | 1.8% |
| Standard Deviation (Sample) | 2.0% | 3.2% |
| Standard Deviation (Population) | 2.0% | 3.1% |
Similar Demographics by 7th Grade
Demographics Similar to Immigrants from Greece by 7th Grade
In terms of 7th grade, the demographic groups most similar to Immigrants from Greece are Spanish (96.3%, a difference of 0.010%), Immigrants from South Central Asia (96.3%, a difference of 0.020%), Burmese (96.3%, a difference of 0.020%), Blackfeet (96.3%, a difference of 0.020%), and Cambodian (96.3%, a difference of 0.030%).
| Demographics | Rating | Rank | 7th Grade |
| Immigrants | Turkey | 90.2 /100 | #137 | Exceptional 96.4% |
| Jordanians | 90.0 /100 | #138 | Excellent 96.4% |
| Basques | 89.3 /100 | #139 | Excellent 96.4% |
| Cambodians | 88.3 /100 | #140 | Excellent 96.3% |
| Immigrants | South Central Asia | 87.1 /100 | #141 | Excellent 96.3% |
| Burmese | 87.1 /100 | #142 | Excellent 96.3% |
| Spanish | 86.6 /100 | #143 | Excellent 96.3% |
| Immigrants | Greece | 85.9 /100 | #144 | Excellent 96.3% |
| Blackfeet | 83.9 /100 | #145 | Excellent 96.3% |
| Immigrants | Eastern Europe | 83.7 /100 | #146 | Excellent 96.3% |
| French American Indians | 83.1 /100 | #147 | Excellent 96.3% |
| Israelis | 82.8 /100 | #148 | Excellent 96.3% |
| Albanians | 82.6 /100 | #149 | Excellent 96.3% |
| Immigrants | Belarus | 82.4 /100 | #150 | Excellent 96.3% |
| Hopi | 81.6 /100 | #151 | Excellent 96.3% |
Demographics Similar to Immigrants from Fiji by 7th Grade
In terms of 7th grade, the demographic groups most similar to Immigrants from Fiji are Belizean (93.5%, a difference of 0.040%), Nicaraguan (93.5%, a difference of 0.080%), Immigrants from Cambodia (93.7%, a difference of 0.17%), Immigrants from Belize (93.4%, a difference of 0.19%), and Dominican (93.3%, a difference of 0.20%).
| Demographics | Rating | Rank | 7th Grade |
| Immigrants | Bangladesh | 0.0 /100 | #313 | Tragic 94.0% |
| Japanese | 0.0 /100 | #314 | Tragic 94.0% |
| Vietnamese | 0.0 /100 | #315 | Tragic 93.9% |
| Immigrants | Vietnam | 0.0 /100 | #316 | Tragic 93.9% |
| Immigrants | Cuba | 0.0 /100 | #317 | Tragic 93.8% |
| Immigrants | Ecuador | 0.0 /100 | #318 | Tragic 93.7% |
| Immigrants | Cambodia | 0.0 /100 | #319 | Tragic 93.7% |
| Immigrants | Fiji | 0.0 /100 | #320 | Tragic 93.5% |
| Belizeans | 0.0 /100 | #321 | Tragic 93.5% |
| Nicaraguans | 0.0 /100 | #322 | Tragic 93.5% |
| Immigrants | Belize | 0.0 /100 | #323 | Tragic 93.4% |
| Dominicans | 0.0 /100 | #324 | Tragic 93.3% |
| Central American Indians | 0.0 /100 | #325 | Tragic 93.3% |
| Nepalese | 0.0 /100 | #326 | Tragic 93.2% |
| Immigrants | Cabo Verde | 0.0 /100 | #327 | Tragic 93.1% |