Portuguese vs Immigrants from Uganda 7th Grade
COMPARE
Portuguese
Immigrants from Uganda
7th Grade
7th Grade Comparison
Portuguese
Immigrants from Uganda
95.8%
7TH GRADE
13.6/ 100
METRIC RATING
211th/ 347
METRIC RANK
96.0%
7TH GRADE
36.0/ 100
METRIC RATING
187th/ 347
METRIC RANK
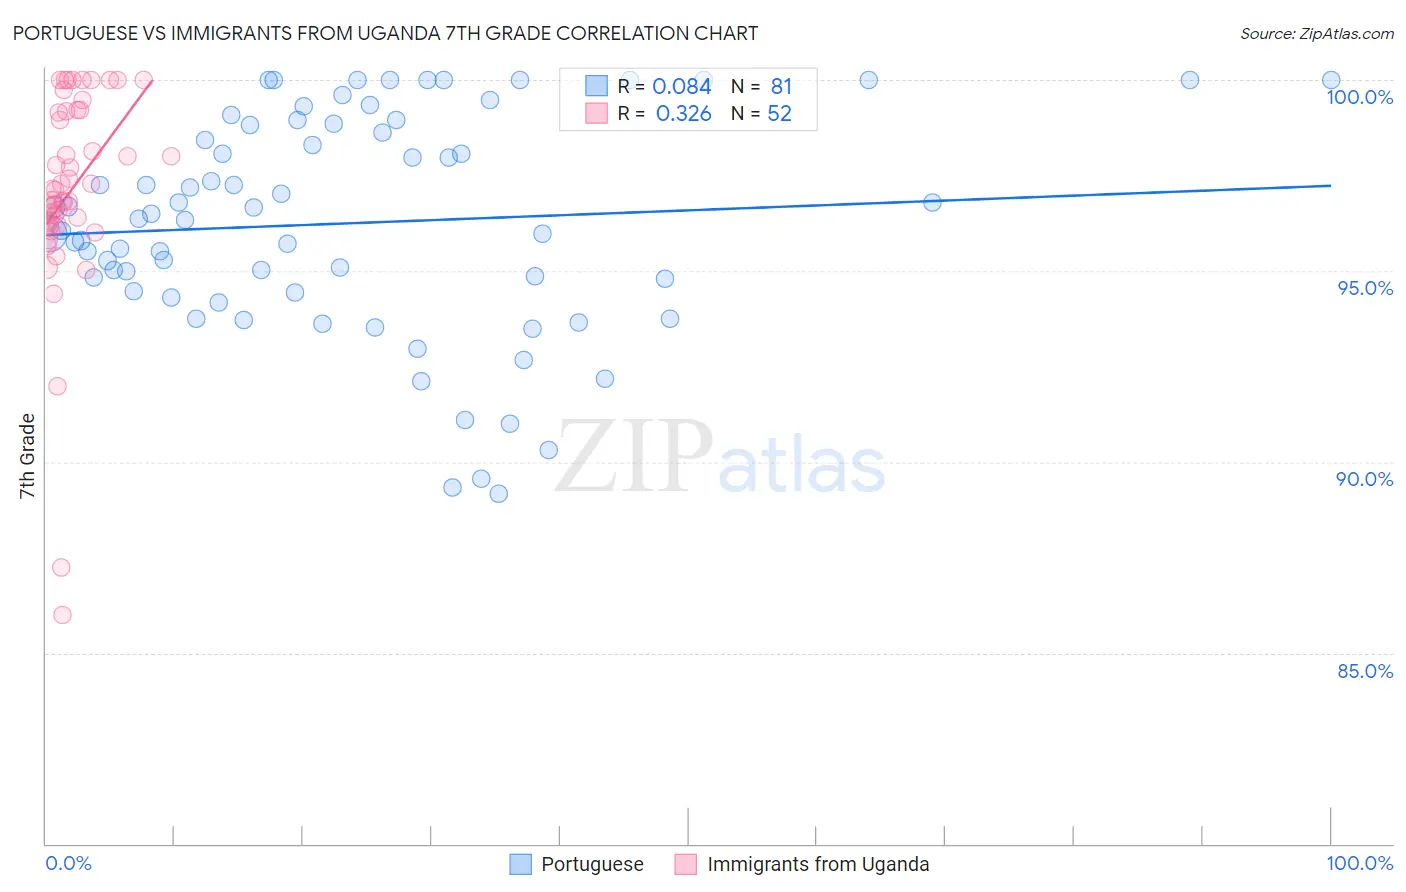
Portuguese vs Immigrants from Uganda 7th Grade Correlation Chart
The statistical analysis conducted on geographies consisting of 450,343,001 people shows a slight positive correlation between the proportion of Portuguese and percentage of population with at least 7th grade education in the United States with a correlation coefficient (R) of 0.084 and weighted average of 95.8%. Similarly, the statistical analysis conducted on geographies consisting of 125,943,496 people shows a mild positive correlation between the proportion of Immigrants from Uganda and percentage of population with at least 7th grade education in the United States with a correlation coefficient (R) of 0.326 and weighted average of 96.0%, a difference of 0.20%.
7th Grade Correlation Summary
| Measurement | Portuguese | Immigrants from Uganda |
| Minimum | 89.2% | 86.0% |
| Maximum | 100.0% | 100.0% |
| Range | 10.8% | 14.0% |
| Mean | 96.3% | 97.1% |
| Median | 96.4% | 97.1% |
| Interquartile 25% (IQ1) | 94.5% | 96.2% |
| Interquartile 75% (IQ3) | 98.8% | 99.2% |
| Interquartile Range (IQR) | 4.4% | 3.0% |
| Standard Deviation (Sample) | 2.8% | 2.8% |
| Standard Deviation (Population) | 2.8% | 2.7% |
Similar Demographics by 7th Grade
Demographics Similar to Portuguese by 7th Grade
In terms of 7th grade, the demographic groups most similar to Portuguese are Immigrants from Lebanon (95.8%, a difference of 0.010%), Immigrants from Morocco (95.8%, a difference of 0.010%), Dutch West Indian (95.8%, a difference of 0.030%), Hawaiian (95.8%, a difference of 0.030%), and Bahamian (95.7%, a difference of 0.030%).
| Demographics | Rating | Rank | 7th Grade |
| Assyrians/Chaldeans/Syriacs | 20.5 /100 | #204 | Fair 95.8% |
| Moroccans | 18.9 /100 | #205 | Poor 95.8% |
| Africans | 17.6 /100 | #206 | Poor 95.8% |
| Navajo | 17.0 /100 | #207 | Poor 95.8% |
| Immigrants | Sudan | 17.0 /100 | #208 | Poor 95.8% |
| Dutch West Indians | 16.1 /100 | #209 | Poor 95.8% |
| Hawaiians | 16.0 /100 | #210 | Poor 95.8% |
| Portuguese | 13.6 /100 | #211 | Poor 95.8% |
| Immigrants | Lebanon | 13.0 /100 | #212 | Poor 95.8% |
| Immigrants | Morocco | 12.6 /100 | #213 | Poor 95.8% |
| Bahamians | 11.6 /100 | #214 | Poor 95.7% |
| Spanish Americans | 9.3 /100 | #215 | Tragic 95.7% |
| Immigrants | Chile | 9.1 /100 | #216 | Tragic 95.7% |
| Immigrants | Pakistan | 9.0 /100 | #217 | Tragic 95.7% |
| Immigrants | Liberia | 8.1 /100 | #218 | Tragic 95.7% |
Demographics Similar to Immigrants from Uganda by 7th Grade
In terms of 7th grade, the demographic groups most similar to Immigrants from Uganda are Immigrants from Iraq (96.0%, a difference of 0.0%), Sierra Leonean (96.0%, a difference of 0.010%), Brazilian (96.0%, a difference of 0.010%), Immigrants from Egypt (95.9%, a difference of 0.010%), and Immigrants from Venezuela (95.9%, a difference of 0.010%).
| Demographics | Rating | Rank | 7th Grade |
| Immigrants | Brazil | 46.8 /100 | #180 | Average 96.0% |
| Pakistanis | 44.5 /100 | #181 | Average 96.0% |
| Iraqis | 41.2 /100 | #182 | Average 96.0% |
| Immigrants | Spain | 38.8 /100 | #183 | Fair 96.0% |
| Sierra Leoneans | 37.5 /100 | #184 | Fair 96.0% |
| Brazilians | 37.3 /100 | #185 | Fair 96.0% |
| Immigrants | Iraq | 36.1 /100 | #186 | Fair 96.0% |
| Immigrants | Uganda | 36.0 /100 | #187 | Fair 96.0% |
| Immigrants | Egypt | 34.3 /100 | #188 | Fair 95.9% |
| Immigrants | Venezuela | 33.9 /100 | #189 | Fair 95.9% |
| Immigrants | Micronesia | 32.6 /100 | #190 | Fair 95.9% |
| Liberians | 32.5 /100 | #191 | Fair 95.9% |
| Panamanians | 32.3 /100 | #192 | Fair 95.9% |
| Immigrants | Bahamas | 30.8 /100 | #193 | Fair 95.9% |
| Immigrants | Nepal | 30.0 /100 | #194 | Fair 95.9% |