Hmong vs Immigrants from Fiji 7th Grade
COMPARE
Hmong
Immigrants from Fiji
7th Grade
7th Grade Comparison
Hmong
Immigrants from Fiji
96.4%
7TH GRADE
91.5/ 100
METRIC RATING
133rd/ 347
METRIC RANK
93.5%
7TH GRADE
0.0/ 100
METRIC RATING
320th/ 347
METRIC RANK
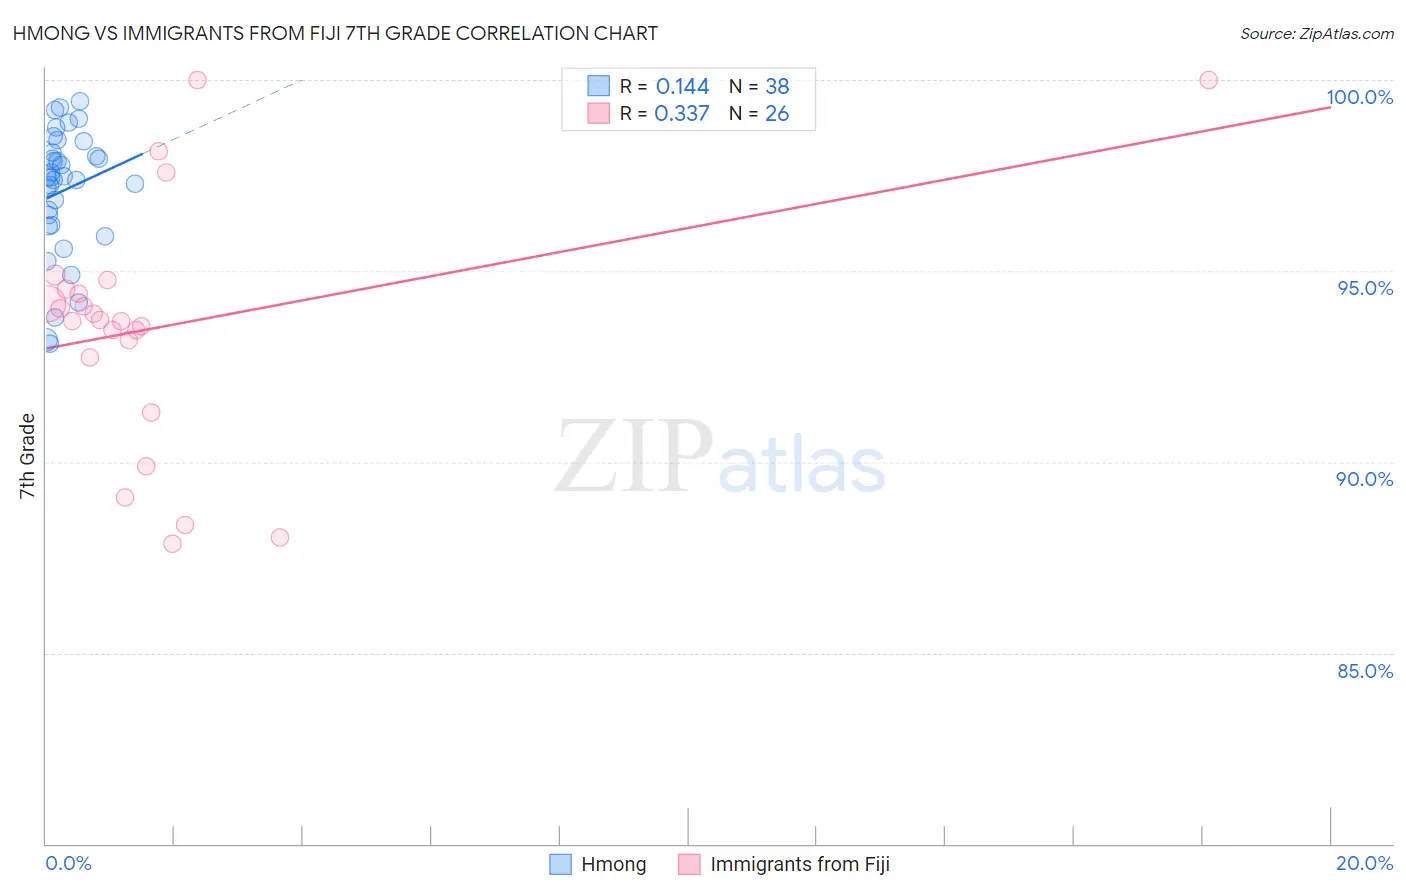
Hmong vs Immigrants from Fiji 7th Grade Correlation Chart
The statistical analysis conducted on geographies consisting of 24,672,093 people shows a poor positive correlation between the proportion of Hmong and percentage of population with at least 7th grade education in the United States with a correlation coefficient (R) of 0.144 and weighted average of 96.4%. Similarly, the statistical analysis conducted on geographies consisting of 93,756,204 people shows a mild positive correlation between the proportion of Immigrants from Fiji and percentage of population with at least 7th grade education in the United States with a correlation coefficient (R) of 0.337 and weighted average of 93.5%, a difference of 3.0%.
7th Grade Correlation Summary
| Measurement | Hmong | Immigrants from Fiji |
| Minimum | 93.1% | 87.9% |
| Maximum | 99.5% | 100.0% |
| Range | 6.4% | 12.1% |
| Mean | 97.1% | 93.6% |
| Median | 97.4% | 93.7% |
| Interquartile 25% (IQ1) | 96.2% | 92.7% |
| Interquartile 75% (IQ3) | 98.1% | 94.5% |
| Interquartile Range (IQR) | 1.9% | 1.8% |
| Standard Deviation (Sample) | 1.6% | 3.2% |
| Standard Deviation (Population) | 1.6% | 3.1% |
Similar Demographics by 7th Grade
Demographics Similar to Hmong by 7th Grade
In terms of 7th grade, the demographic groups most similar to Hmong are Filipino (96.4%, a difference of 0.010%), Colville (96.4%, a difference of 0.010%), Soviet Union (96.4%, a difference of 0.010%), Immigrants from Kuwait (96.4%, a difference of 0.010%), and Immigrants from Hungary (96.4%, a difference of 0.020%).
| Demographics | Rating | Rank | 7th Grade |
| Palestinians | 93.5 /100 | #126 | Exceptional 96.4% |
| Immigrants | Bosnia and Herzegovina | 93.3 /100 | #127 | Exceptional 96.4% |
| Immigrants | Romania | 93.2 /100 | #128 | Exceptional 96.4% |
| Immigrants | North Macedonia | 93.1 /100 | #129 | Exceptional 96.4% |
| Immigrants | Serbia | 92.8 /100 | #130 | Exceptional 96.4% |
| Filipinos | 92.1 /100 | #131 | Exceptional 96.4% |
| Colville | 91.7 /100 | #132 | Exceptional 96.4% |
| Hmong | 91.5 /100 | #133 | Exceptional 96.4% |
| Soviet Union | 91.2 /100 | #134 | Exceptional 96.4% |
| Immigrants | Kuwait | 91.1 /100 | #135 | Exceptional 96.4% |
| Immigrants | Hungary | 90.6 /100 | #136 | Exceptional 96.4% |
| Immigrants | Turkey | 90.2 /100 | #137 | Exceptional 96.4% |
| Jordanians | 90.0 /100 | #138 | Excellent 96.4% |
| Basques | 89.3 /100 | #139 | Excellent 96.4% |
| Cambodians | 88.3 /100 | #140 | Excellent 96.3% |
Demographics Similar to Immigrants from Fiji by 7th Grade
In terms of 7th grade, the demographic groups most similar to Immigrants from Fiji are Belizean (93.5%, a difference of 0.040%), Nicaraguan (93.5%, a difference of 0.080%), Immigrants from Cambodia (93.7%, a difference of 0.17%), Immigrants from Belize (93.4%, a difference of 0.19%), and Dominican (93.3%, a difference of 0.20%).
| Demographics | Rating | Rank | 7th Grade |
| Immigrants | Bangladesh | 0.0 /100 | #313 | Tragic 94.0% |
| Japanese | 0.0 /100 | #314 | Tragic 94.0% |
| Vietnamese | 0.0 /100 | #315 | Tragic 93.9% |
| Immigrants | Vietnam | 0.0 /100 | #316 | Tragic 93.9% |
| Immigrants | Cuba | 0.0 /100 | #317 | Tragic 93.8% |
| Immigrants | Ecuador | 0.0 /100 | #318 | Tragic 93.7% |
| Immigrants | Cambodia | 0.0 /100 | #319 | Tragic 93.7% |
| Immigrants | Fiji | 0.0 /100 | #320 | Tragic 93.5% |
| Belizeans | 0.0 /100 | #321 | Tragic 93.5% |
| Nicaraguans | 0.0 /100 | #322 | Tragic 93.5% |
| Immigrants | Belize | 0.0 /100 | #323 | Tragic 93.4% |
| Dominicans | 0.0 /100 | #324 | Tragic 93.3% |
| Central American Indians | 0.0 /100 | #325 | Tragic 93.3% |
| Nepalese | 0.0 /100 | #326 | Tragic 93.2% |
| Immigrants | Cabo Verde | 0.0 /100 | #327 | Tragic 93.1% |