Bulgarian vs Immigrants from Fiji 7th Grade
COMPARE
Bulgarian
Immigrants from Fiji
7th Grade
7th Grade Comparison
Bulgarians
Immigrants from Fiji
97.1%
7TH GRADE
99.9/ 100
METRIC RATING
47th/ 347
METRIC RANK
93.5%
7TH GRADE
0.0/ 100
METRIC RATING
320th/ 347
METRIC RANK
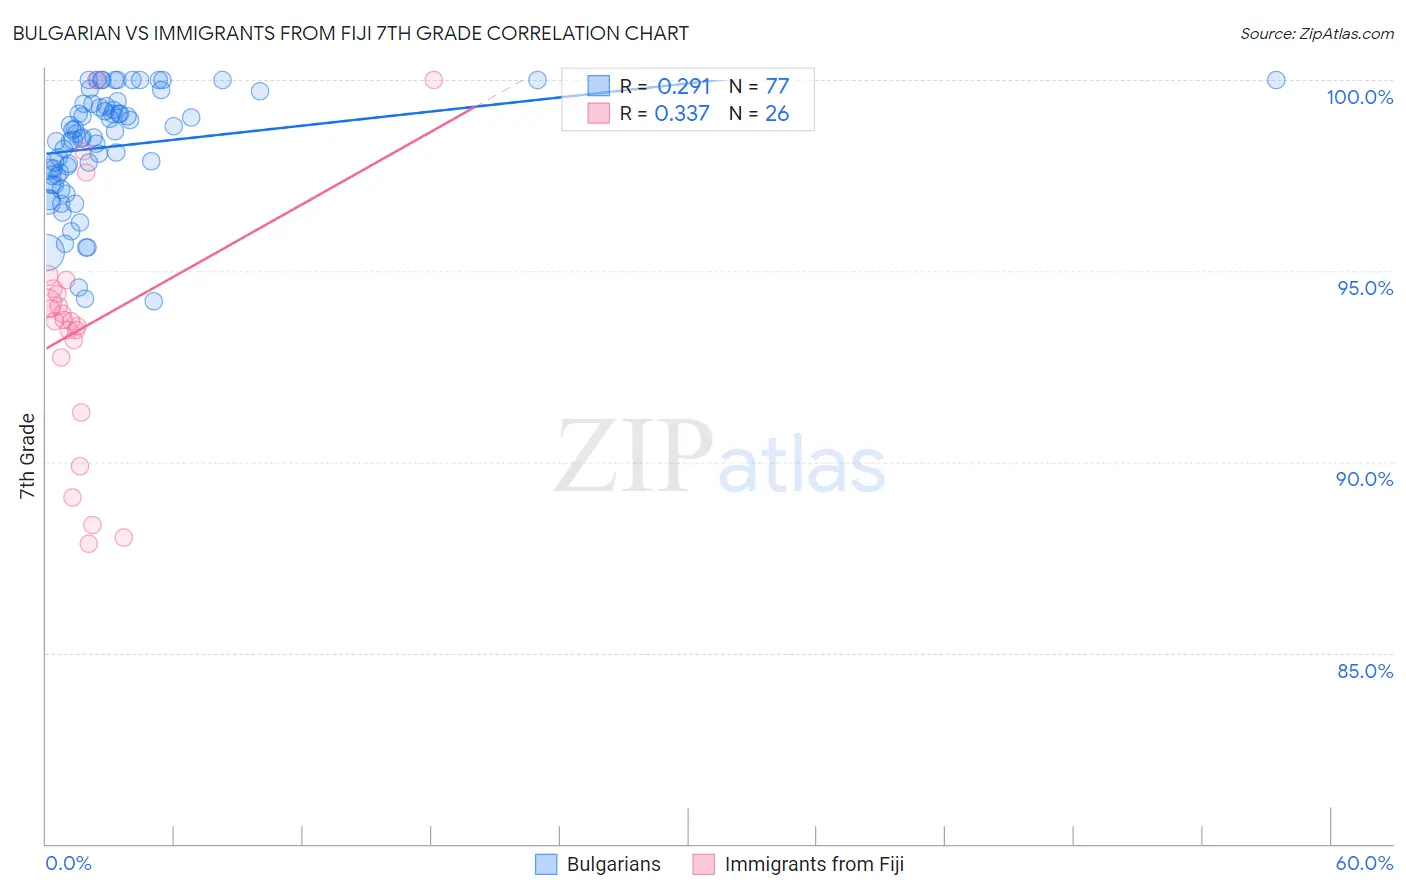
Bulgarian vs Immigrants from Fiji 7th Grade Correlation Chart
The statistical analysis conducted on geographies consisting of 205,632,052 people shows a weak positive correlation between the proportion of Bulgarians and percentage of population with at least 7th grade education in the United States with a correlation coefficient (R) of 0.291 and weighted average of 97.1%. Similarly, the statistical analysis conducted on geographies consisting of 93,756,204 people shows a mild positive correlation between the proportion of Immigrants from Fiji and percentage of population with at least 7th grade education in the United States with a correlation coefficient (R) of 0.337 and weighted average of 93.5%, a difference of 3.8%.
7th Grade Correlation Summary
| Measurement | Bulgarian | Immigrants from Fiji |
| Minimum | 94.2% | 87.9% |
| Maximum | 100.0% | 100.0% |
| Range | 5.8% | 12.1% |
| Mean | 98.3% | 93.6% |
| Median | 98.5% | 93.7% |
| Interquartile 25% (IQ1) | 97.5% | 92.7% |
| Interquartile 75% (IQ3) | 99.4% | 94.5% |
| Interquartile Range (IQR) | 1.9% | 1.8% |
| Standard Deviation (Sample) | 1.5% | 3.2% |
| Standard Deviation (Population) | 1.5% | 3.1% |
Similar Demographics by 7th Grade
Demographics Similar to Bulgarians by 7th Grade
In terms of 7th grade, the demographic groups most similar to Bulgarians are Celtic (97.1%, a difference of 0.010%), Slavic (97.1%, a difference of 0.010%), Aleut (97.1%, a difference of 0.020%), Immigrants from Scotland (97.1%, a difference of 0.020%), and Northern European (97.1%, a difference of 0.030%).
| Demographics | Rating | Rank | 7th Grade |
| Luxembourgers | 100.0 /100 | #40 | Exceptional 97.2% |
| Eastern Europeans | 100.0 /100 | #41 | Exceptional 97.2% |
| Chinese | 99.9 /100 | #42 | Exceptional 97.1% |
| Maltese | 99.9 /100 | #43 | Exceptional 97.1% |
| Northern Europeans | 99.9 /100 | #44 | Exceptional 97.1% |
| Czechoslovakians | 99.9 /100 | #45 | Exceptional 97.1% |
| Aleuts | 99.9 /100 | #46 | Exceptional 97.1% |
| Bulgarians | 99.9 /100 | #47 | Exceptional 97.1% |
| Celtics | 99.9 /100 | #48 | Exceptional 97.1% |
| Slavs | 99.9 /100 | #49 | Exceptional 97.1% |
| Immigrants | Scotland | 99.9 /100 | #50 | Exceptional 97.1% |
| Estonians | 99.9 /100 | #51 | Exceptional 97.0% |
| Greeks | 99.9 /100 | #52 | Exceptional 97.0% |
| Austrians | 99.8 /100 | #53 | Exceptional 97.0% |
| Australians | 99.8 /100 | #54 | Exceptional 97.0% |
Demographics Similar to Immigrants from Fiji by 7th Grade
In terms of 7th grade, the demographic groups most similar to Immigrants from Fiji are Belizean (93.5%, a difference of 0.040%), Nicaraguan (93.5%, a difference of 0.080%), Immigrants from Cambodia (93.7%, a difference of 0.17%), Immigrants from Belize (93.4%, a difference of 0.19%), and Dominican (93.3%, a difference of 0.20%).
| Demographics | Rating | Rank | 7th Grade |
| Immigrants | Bangladesh | 0.0 /100 | #313 | Tragic 94.0% |
| Japanese | 0.0 /100 | #314 | Tragic 94.0% |
| Vietnamese | 0.0 /100 | #315 | Tragic 93.9% |
| Immigrants | Vietnam | 0.0 /100 | #316 | Tragic 93.9% |
| Immigrants | Cuba | 0.0 /100 | #317 | Tragic 93.8% |
| Immigrants | Ecuador | 0.0 /100 | #318 | Tragic 93.7% |
| Immigrants | Cambodia | 0.0 /100 | #319 | Tragic 93.7% |
| Immigrants | Fiji | 0.0 /100 | #320 | Tragic 93.5% |
| Belizeans | 0.0 /100 | #321 | Tragic 93.5% |
| Nicaraguans | 0.0 /100 | #322 | Tragic 93.5% |
| Immigrants | Belize | 0.0 /100 | #323 | Tragic 93.4% |
| Dominicans | 0.0 /100 | #324 | Tragic 93.3% |
| Central American Indians | 0.0 /100 | #325 | Tragic 93.3% |
| Nepalese | 0.0 /100 | #326 | Tragic 93.2% |
| Immigrants | Cabo Verde | 0.0 /100 | #327 | Tragic 93.1% |