Portuguese vs Immigrants from Croatia College, Under 1 year
COMPARE
Portuguese
Immigrants from Croatia
College, Under 1 year
College, Under 1 year Comparison
Portuguese
Immigrants from Croatia
63.4%
COLLEGE, UNDER 1 YEAR
5.6/ 100
METRIC RATING
220th/ 347
METRIC RANK
67.8%
COLLEGE, UNDER 1 YEAR
96.6/ 100
METRIC RATING
106th/ 347
METRIC RANK
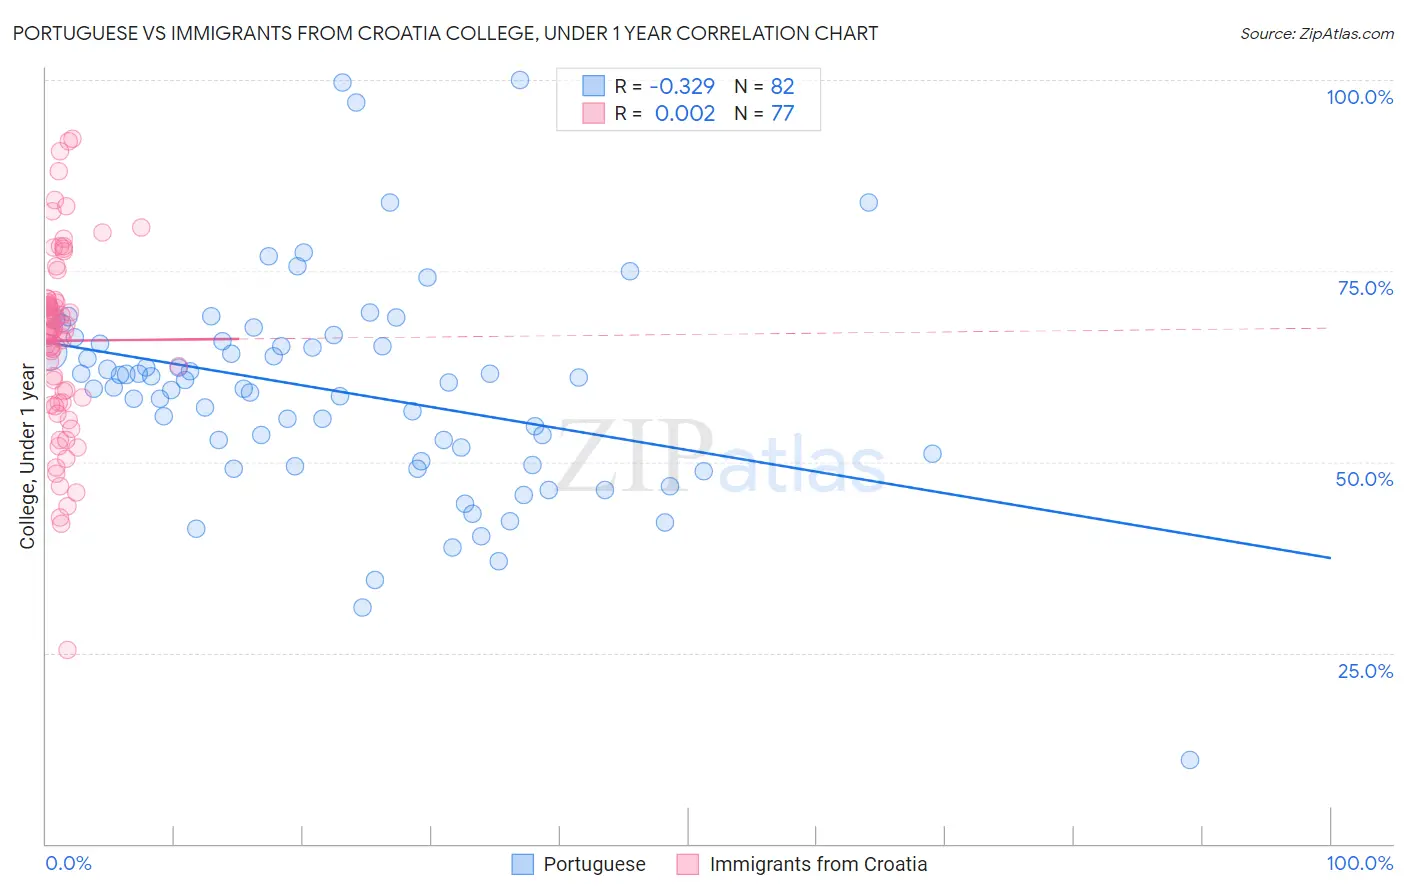
Portuguese vs Immigrants from Croatia College, Under 1 year Correlation Chart
The statistical analysis conducted on geographies consisting of 450,365,822 people shows a mild negative correlation between the proportion of Portuguese and percentage of population with at least college, under 1 year education in the United States with a correlation coefficient (R) of -0.329 and weighted average of 63.4%. Similarly, the statistical analysis conducted on geographies consisting of 132,577,989 people shows no correlation between the proportion of Immigrants from Croatia and percentage of population with at least college, under 1 year education in the United States with a correlation coefficient (R) of 0.002 and weighted average of 67.8%, a difference of 7.0%.
College, Under 1 year Correlation Summary
| Measurement | Portuguese | Immigrants from Croatia |
| Minimum | 11.0% | 25.4% |
| Maximum | 100.0% | 92.2% |
| Range | 89.0% | 66.8% |
| Mean | 59.1% | 65.9% |
| Median | 60.1% | 67.1% |
| Interquartile 25% (IQ1) | 50.1% | 57.8% |
| Interquartile 75% (IQ3) | 65.5% | 71.3% |
| Interquartile Range (IQR) | 15.4% | 13.5% |
| Standard Deviation (Sample) | 14.2% | 12.3% |
| Standard Deviation (Population) | 14.1% | 12.3% |
Similar Demographics by College, Under 1 year
Demographics Similar to Portuguese by College, Under 1 year
In terms of college, under 1 year, the demographic groups most similar to Portuguese are Immigrants from Fiji (63.4%, a difference of 0.020%), Immigrants from Panama (63.4%, a difference of 0.030%), Immigrants from Uruguay (63.4%, a difference of 0.050%), Cree (63.3%, a difference of 0.090%), and Immigrants from Senegal (63.3%, a difference of 0.14%).
| Demographics | Rating | Rank | College, Under 1 year |
| Immigrants | South America | 9.1 /100 | #213 | Tragic 63.8% |
| Immigrants | Nigeria | 8.8 /100 | #214 | Tragic 63.7% |
| Senegalese | 7.7 /100 | #215 | Tragic 63.6% |
| Hmong | 6.8 /100 | #216 | Tragic 63.5% |
| Immigrants | Uruguay | 5.8 /100 | #217 | Tragic 63.4% |
| Immigrants | Panama | 5.7 /100 | #218 | Tragic 63.4% |
| Immigrants | Fiji | 5.7 /100 | #219 | Tragic 63.4% |
| Portuguese | 5.6 /100 | #220 | Tragic 63.4% |
| Cree | 5.2 /100 | #221 | Tragic 63.3% |
| Immigrants | Senegal | 5.0 /100 | #222 | Tragic 63.3% |
| Immigrants | Costa Rica | 4.5 /100 | #223 | Tragic 63.2% |
| Sub-Saharan Africans | 4.4 /100 | #224 | Tragic 63.2% |
| Immigrants | Peru | 4.0 /100 | #225 | Tragic 63.1% |
| Immigrants | Colombia | 4.0 /100 | #226 | Tragic 63.1% |
| Immigrants | Ghana | 3.7 /100 | #227 | Tragic 63.1% |
Demographics Similar to Immigrants from Croatia by College, Under 1 year
In terms of college, under 1 year, the demographic groups most similar to Immigrants from Croatia are Immigrants from Western Asia (67.8%, a difference of 0.010%), Afghan (67.8%, a difference of 0.010%), Austrian (67.8%, a difference of 0.060%), Palestinian (67.9%, a difference of 0.090%), and Carpatho Rusyn (67.9%, a difference of 0.090%).
| Demographics | Rating | Rank | College, Under 1 year |
| Immigrants | Bolivia | 97.0 /100 | #99 | Exceptional 67.9% |
| Immigrants | Argentina | 97.0 /100 | #100 | Exceptional 67.9% |
| Immigrants | Eastern Europe | 96.9 /100 | #101 | Exceptional 67.9% |
| Palestinians | 96.9 /100 | #102 | Exceptional 67.9% |
| Carpatho Rusyns | 96.8 /100 | #103 | Exceptional 67.9% |
| Immigrants | Western Asia | 96.6 /100 | #104 | Exceptional 67.8% |
| Afghans | 96.6 /100 | #105 | Exceptional 67.8% |
| Immigrants | Croatia | 96.6 /100 | #106 | Exceptional 67.8% |
| Austrians | 96.4 /100 | #107 | Exceptional 67.8% |
| Immigrants | Egypt | 96.0 /100 | #108 | Exceptional 67.7% |
| Scandinavians | 95.8 /100 | #109 | Exceptional 67.7% |
| Assyrians/Chaldeans/Syriacs | 95.8 /100 | #110 | Exceptional 67.7% |
| Ukrainians | 95.8 /100 | #111 | Exceptional 67.7% |
| Macedonians | 95.7 /100 | #112 | Exceptional 67.6% |
| Syrians | 95.6 /100 | #113 | Exceptional 67.6% |