Immigrants from Malaysia vs Immigrants from Croatia College, Under 1 year
COMPARE
Immigrants from Malaysia
Immigrants from Croatia
College, Under 1 year
College, Under 1 year Comparison
Immigrants from Malaysia
Immigrants from Croatia
69.3%
COLLEGE, UNDER 1 YEAR
99.6/ 100
METRIC RATING
58th/ 347
METRIC RANK
67.8%
COLLEGE, UNDER 1 YEAR
96.6/ 100
METRIC RATING
106th/ 347
METRIC RANK
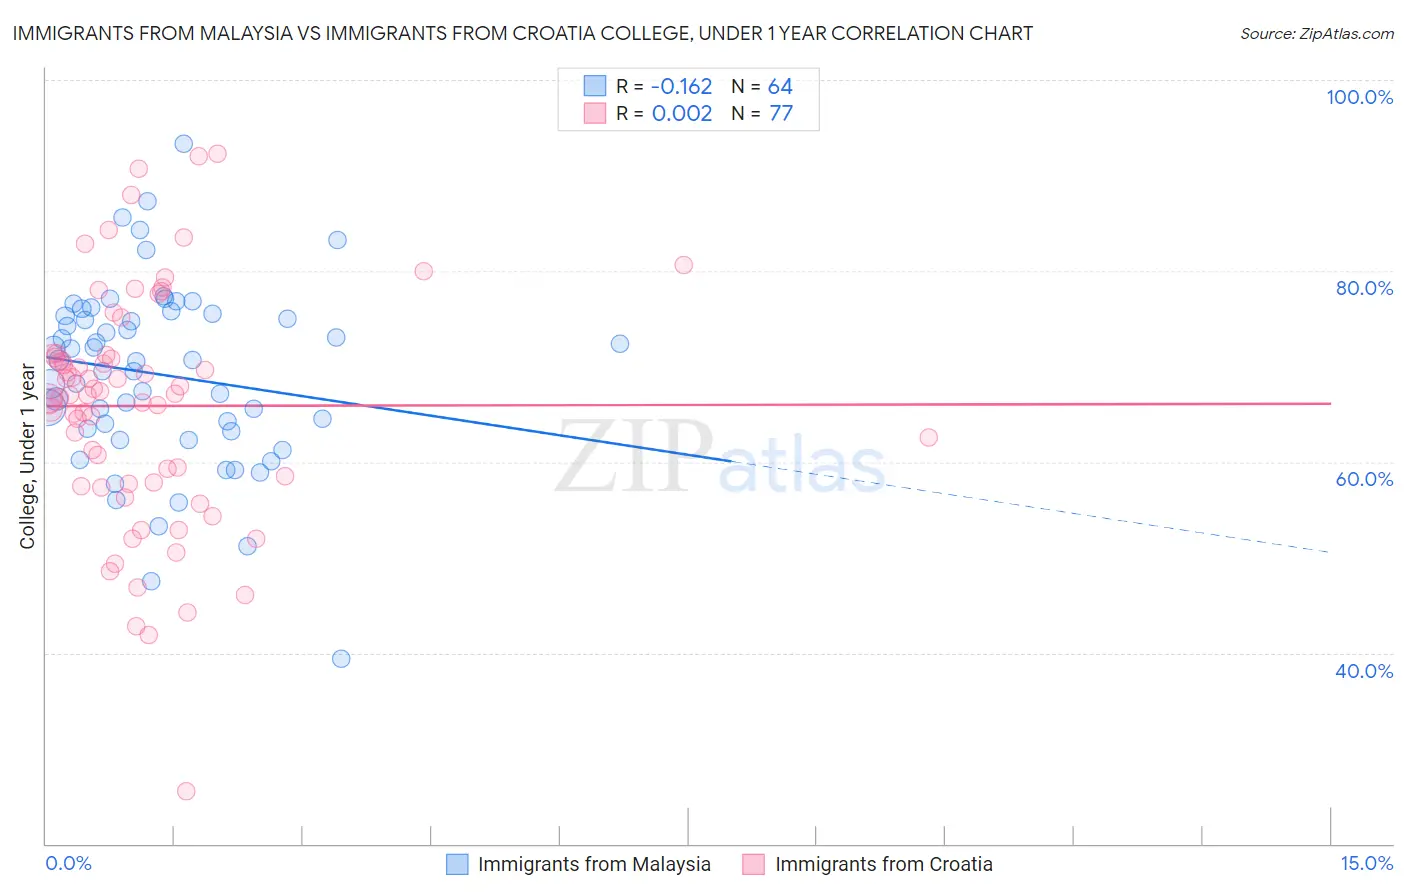
Immigrants from Malaysia vs Immigrants from Croatia College, Under 1 year Correlation Chart
The statistical analysis conducted on geographies consisting of 197,973,854 people shows a poor negative correlation between the proportion of Immigrants from Malaysia and percentage of population with at least college, under 1 year education in the United States with a correlation coefficient (R) of -0.162 and weighted average of 69.3%. Similarly, the statistical analysis conducted on geographies consisting of 132,577,989 people shows no correlation between the proportion of Immigrants from Croatia and percentage of population with at least college, under 1 year education in the United States with a correlation coefficient (R) of 0.002 and weighted average of 67.8%, a difference of 2.2%.
College, Under 1 year Correlation Summary
| Measurement | Immigrants from Malaysia | Immigrants from Croatia |
| Minimum | 39.4% | 25.4% |
| Maximum | 93.4% | 92.2% |
| Range | 54.0% | 66.8% |
| Mean | 69.1% | 65.9% |
| Median | 70.6% | 67.1% |
| Interquartile 25% (IQ1) | 63.3% | 57.8% |
| Interquartile 75% (IQ3) | 75.4% | 71.3% |
| Interquartile Range (IQR) | 12.1% | 13.5% |
| Standard Deviation (Sample) | 9.6% | 12.3% |
| Standard Deviation (Population) | 9.6% | 12.3% |
Similar Demographics by College, Under 1 year
Demographics Similar to Immigrants from Malaysia by College, Under 1 year
In terms of college, under 1 year, the demographic groups most similar to Immigrants from Malaysia are Asian (69.4%, a difference of 0.10%), Immigrants from Scotland (69.4%, a difference of 0.12%), Immigrants from Serbia (69.3%, a difference of 0.13%), Immigrants from Asia (69.2%, a difference of 0.22%), and Maltese (69.5%, a difference of 0.24%).
| Demographics | Rating | Rank | College, Under 1 year |
| Mongolians | 99.8 /100 | #51 | Exceptional 69.9% |
| Immigrants | Russia | 99.8 /100 | #52 | Exceptional 69.9% |
| South Africans | 99.7 /100 | #53 | Exceptional 69.7% |
| Immigrants | Czechoslovakia | 99.7 /100 | #54 | Exceptional 69.6% |
| Maltese | 99.7 /100 | #55 | Exceptional 69.5% |
| Immigrants | Scotland | 99.6 /100 | #56 | Exceptional 69.4% |
| Asians | 99.6 /100 | #57 | Exceptional 69.4% |
| Immigrants | Malaysia | 99.6 /100 | #58 | Exceptional 69.3% |
| Immigrants | Serbia | 99.5 /100 | #59 | Exceptional 69.3% |
| Immigrants | Asia | 99.5 /100 | #60 | Exceptional 69.2% |
| Immigrants | Kazakhstan | 99.5 /100 | #61 | Exceptional 69.2% |
| Immigrants | Belarus | 99.5 /100 | #62 | Exceptional 69.2% |
| Immigrants | Canada | 99.4 /100 | #63 | Exceptional 69.1% |
| Northern Europeans | 99.4 /100 | #64 | Exceptional 69.0% |
| Immigrants | Moldova | 99.3 /100 | #65 | Exceptional 69.0% |
Demographics Similar to Immigrants from Croatia by College, Under 1 year
In terms of college, under 1 year, the demographic groups most similar to Immigrants from Croatia are Immigrants from Western Asia (67.8%, a difference of 0.010%), Afghan (67.8%, a difference of 0.010%), Austrian (67.8%, a difference of 0.060%), Palestinian (67.9%, a difference of 0.090%), and Carpatho Rusyn (67.9%, a difference of 0.090%).
| Demographics | Rating | Rank | College, Under 1 year |
| Immigrants | Bolivia | 97.0 /100 | #99 | Exceptional 67.9% |
| Immigrants | Argentina | 97.0 /100 | #100 | Exceptional 67.9% |
| Immigrants | Eastern Europe | 96.9 /100 | #101 | Exceptional 67.9% |
| Palestinians | 96.9 /100 | #102 | Exceptional 67.9% |
| Carpatho Rusyns | 96.8 /100 | #103 | Exceptional 67.9% |
| Immigrants | Western Asia | 96.6 /100 | #104 | Exceptional 67.8% |
| Afghans | 96.6 /100 | #105 | Exceptional 67.8% |
| Immigrants | Croatia | 96.6 /100 | #106 | Exceptional 67.8% |
| Austrians | 96.4 /100 | #107 | Exceptional 67.8% |
| Immigrants | Egypt | 96.0 /100 | #108 | Exceptional 67.7% |
| Scandinavians | 95.8 /100 | #109 | Exceptional 67.7% |
| Assyrians/Chaldeans/Syriacs | 95.8 /100 | #110 | Exceptional 67.7% |
| Ukrainians | 95.8 /100 | #111 | Exceptional 67.7% |
| Macedonians | 95.7 /100 | #112 | Exceptional 67.6% |
| Syrians | 95.6 /100 | #113 | Exceptional 67.6% |