Portuguese vs Immigrants from Oceania College, Under 1 year
COMPARE
Portuguese
Immigrants from Oceania
College, Under 1 year
College, Under 1 year Comparison
Portuguese
Immigrants from Oceania
63.4%
COLLEGE, UNDER 1 YEAR
5.6/ 100
METRIC RATING
220th/ 347
METRIC RANK
65.6%
COLLEGE, UNDER 1 YEAR
55.0/ 100
METRIC RATING
171st/ 347
METRIC RANK
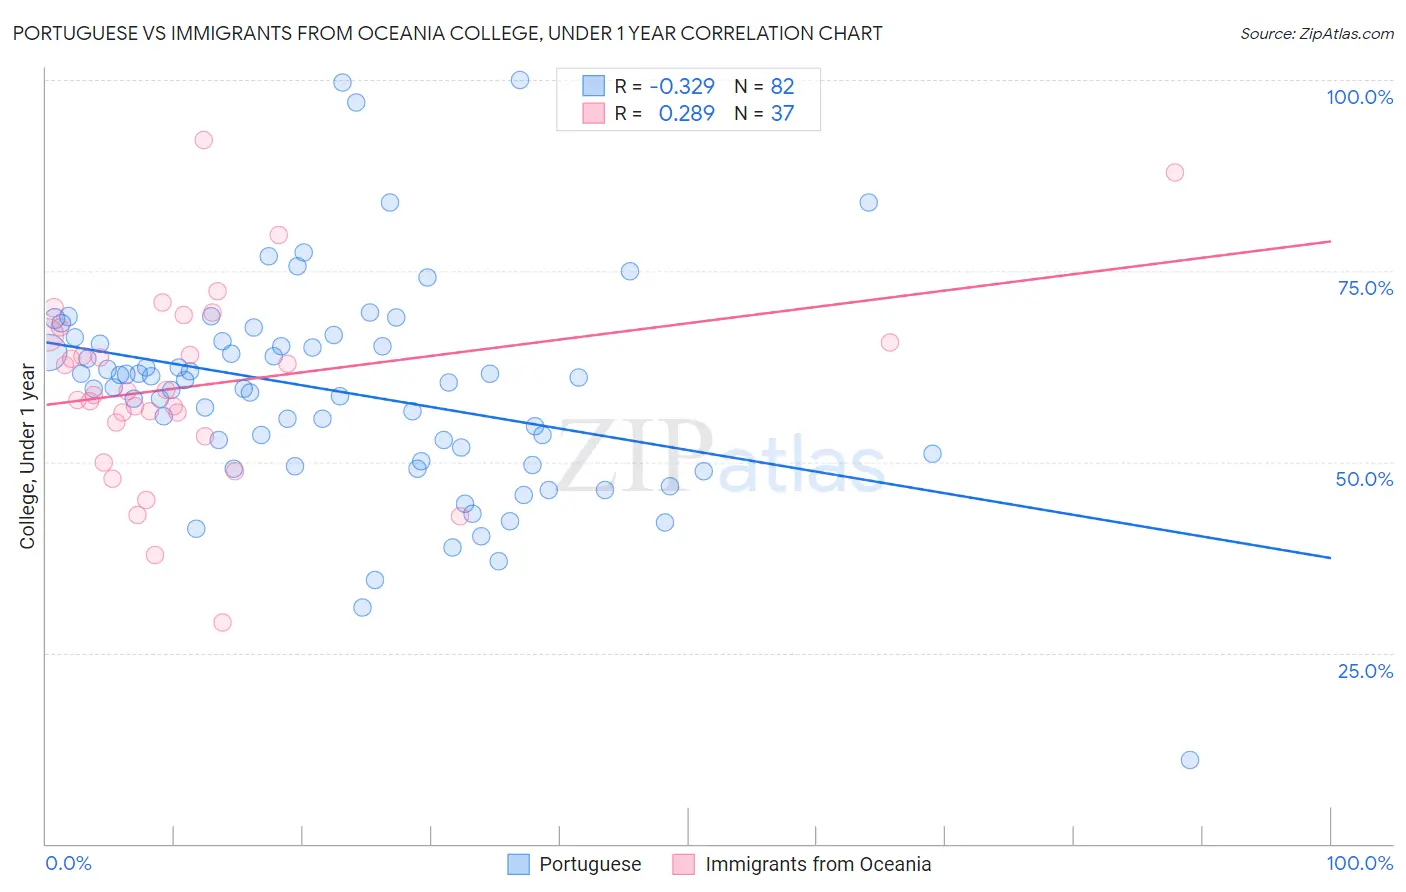
Portuguese vs Immigrants from Oceania College, Under 1 year Correlation Chart
The statistical analysis conducted on geographies consisting of 450,365,822 people shows a mild negative correlation between the proportion of Portuguese and percentage of population with at least college, under 1 year education in the United States with a correlation coefficient (R) of -0.329 and weighted average of 63.4%. Similarly, the statistical analysis conducted on geographies consisting of 305,519,500 people shows a weak positive correlation between the proportion of Immigrants from Oceania and percentage of population with at least college, under 1 year education in the United States with a correlation coefficient (R) of 0.289 and weighted average of 65.6%, a difference of 3.4%.
College, Under 1 year Correlation Summary
| Measurement | Portuguese | Immigrants from Oceania |
| Minimum | 11.0% | 28.9% |
| Maximum | 100.0% | 92.2% |
| Range | 89.0% | 63.2% |
| Mean | 59.1% | 60.1% |
| Median | 60.1% | 59.2% |
| Interquartile 25% (IQ1) | 50.1% | 54.3% |
| Interquartile 75% (IQ3) | 65.5% | 67.1% |
| Interquartile Range (IQR) | 15.4% | 12.8% |
| Standard Deviation (Sample) | 14.2% | 12.6% |
| Standard Deviation (Population) | 14.1% | 12.4% |
Similar Demographics by College, Under 1 year
Demographics Similar to Portuguese by College, Under 1 year
In terms of college, under 1 year, the demographic groups most similar to Portuguese are Immigrants from Fiji (63.4%, a difference of 0.020%), Immigrants from Panama (63.4%, a difference of 0.030%), Immigrants from Uruguay (63.4%, a difference of 0.050%), Cree (63.3%, a difference of 0.090%), and Immigrants from Senegal (63.3%, a difference of 0.14%).
| Demographics | Rating | Rank | College, Under 1 year |
| Immigrants | South America | 9.1 /100 | #213 | Tragic 63.8% |
| Immigrants | Nigeria | 8.8 /100 | #214 | Tragic 63.7% |
| Senegalese | 7.7 /100 | #215 | Tragic 63.6% |
| Hmong | 6.8 /100 | #216 | Tragic 63.5% |
| Immigrants | Uruguay | 5.8 /100 | #217 | Tragic 63.4% |
| Immigrants | Panama | 5.7 /100 | #218 | Tragic 63.4% |
| Immigrants | Fiji | 5.7 /100 | #219 | Tragic 63.4% |
| Portuguese | 5.6 /100 | #220 | Tragic 63.4% |
| Cree | 5.2 /100 | #221 | Tragic 63.3% |
| Immigrants | Senegal | 5.0 /100 | #222 | Tragic 63.3% |
| Immigrants | Costa Rica | 4.5 /100 | #223 | Tragic 63.2% |
| Sub-Saharan Africans | 4.4 /100 | #224 | Tragic 63.2% |
| Immigrants | Peru | 4.0 /100 | #225 | Tragic 63.1% |
| Immigrants | Colombia | 4.0 /100 | #226 | Tragic 63.1% |
| Immigrants | Ghana | 3.7 /100 | #227 | Tragic 63.1% |
Demographics Similar to Immigrants from Oceania by College, Under 1 year
In terms of college, under 1 year, the demographic groups most similar to Immigrants from Oceania are Yugoslavian (65.6%, a difference of 0.030%), German (65.6%, a difference of 0.030%), South American Indian (65.5%, a difference of 0.030%), Hungarian (65.6%, a difference of 0.040%), and Swiss (65.5%, a difference of 0.050%).
| Demographics | Rating | Rank | College, Under 1 year |
| Czechoslovakians | 62.6 /100 | #164 | Good 65.8% |
| Immigrants | Uzbekistan | 61.6 /100 | #165 | Good 65.8% |
| Moroccans | 56.7 /100 | #166 | Average 65.6% |
| Immigrants | Somalia | 56.4 /100 | #167 | Average 65.6% |
| Hungarians | 55.9 /100 | #168 | Average 65.6% |
| Yugoslavians | 55.7 /100 | #169 | Average 65.6% |
| Germans | 55.7 /100 | #170 | Average 65.6% |
| Immigrants | Oceania | 55.0 /100 | #171 | Average 65.6% |
| South American Indians | 54.4 /100 | #172 | Average 65.5% |
| Swiss | 53.9 /100 | #173 | Average 65.5% |
| Immigrants | Bosnia and Herzegovina | 50.0 /100 | #174 | Average 65.4% |
| Scotch-Irish | 49.5 /100 | #175 | Average 65.4% |
| French | 48.9 /100 | #176 | Average 65.4% |
| Immigrants | North Macedonia | 48.6 /100 | #177 | Average 65.4% |
| German Russians | 48.3 /100 | #178 | Average 65.4% |