Immigrants from Turkey vs Immigrants from Croatia College, Under 1 year
COMPARE
Immigrants from Turkey
Immigrants from Croatia
College, Under 1 year
College, Under 1 year Comparison
Immigrants from Turkey
Immigrants from Croatia
70.3%
COLLEGE, UNDER 1 YEAR
99.9/ 100
METRIC RATING
40th/ 347
METRIC RANK
67.8%
COLLEGE, UNDER 1 YEAR
96.6/ 100
METRIC RATING
106th/ 347
METRIC RANK
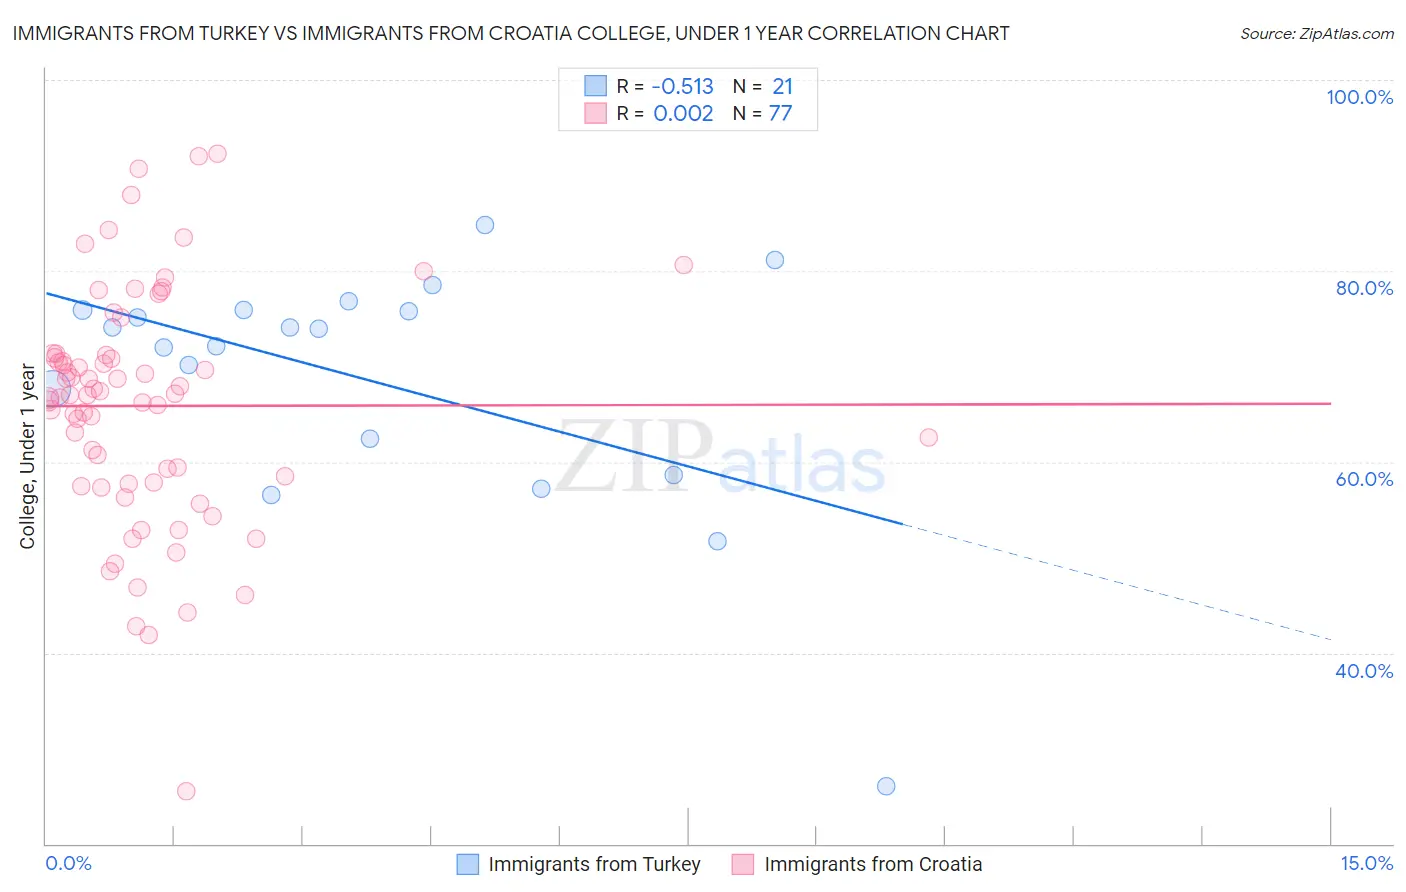
Immigrants from Turkey vs Immigrants from Croatia College, Under 1 year Correlation Chart
The statistical analysis conducted on geographies consisting of 223,057,840 people shows a substantial negative correlation between the proportion of Immigrants from Turkey and percentage of population with at least college, under 1 year education in the United States with a correlation coefficient (R) of -0.513 and weighted average of 70.3%. Similarly, the statistical analysis conducted on geographies consisting of 132,577,989 people shows no correlation between the proportion of Immigrants from Croatia and percentage of population with at least college, under 1 year education in the United States with a correlation coefficient (R) of 0.002 and weighted average of 67.8%, a difference of 3.7%.
College, Under 1 year Correlation Summary
| Measurement | Immigrants from Turkey | Immigrants from Croatia |
| Minimum | 26.0% | 25.4% |
| Maximum | 84.8% | 92.2% |
| Range | 58.8% | 66.8% |
| Mean | 68.6% | 65.9% |
| Median | 74.0% | 67.1% |
| Interquartile 25% (IQ1) | 60.6% | 57.8% |
| Interquartile 75% (IQ3) | 75.9% | 71.3% |
| Interquartile Range (IQR) | 15.3% | 13.5% |
| Standard Deviation (Sample) | 13.1% | 12.3% |
| Standard Deviation (Population) | 12.8% | 12.3% |
Similar Demographics by College, Under 1 year
Demographics Similar to Immigrants from Turkey by College, Under 1 year
In terms of college, under 1 year, the demographic groups most similar to Immigrants from Turkey are Bhutanese (70.3%, a difference of 0.010%), Australian (70.4%, a difference of 0.030%), Immigrants from Kuwait (70.3%, a difference of 0.040%), Immigrants from Lithuania (70.3%, a difference of 0.090%), and Immigrants from Saudi Arabia (70.4%, a difference of 0.10%).
| Demographics | Rating | Rank | College, Under 1 year |
| Immigrants | South Africa | 99.9 /100 | #33 | Exceptional 70.6% |
| Estonians | 99.9 /100 | #34 | Exceptional 70.6% |
| Russians | 99.9 /100 | #35 | Exceptional 70.5% |
| Immigrants | Sri Lanka | 99.9 /100 | #36 | Exceptional 70.5% |
| Immigrants | Saudi Arabia | 99.9 /100 | #37 | Exceptional 70.4% |
| Australians | 99.9 /100 | #38 | Exceptional 70.4% |
| Bhutanese | 99.9 /100 | #39 | Exceptional 70.3% |
| Immigrants | Turkey | 99.9 /100 | #40 | Exceptional 70.3% |
| Immigrants | Kuwait | 99.9 /100 | #41 | Exceptional 70.3% |
| Immigrants | Lithuania | 99.9 /100 | #42 | Exceptional 70.3% |
| Israelis | 99.9 /100 | #43 | Exceptional 70.2% |
| New Zealanders | 99.9 /100 | #44 | Exceptional 70.2% |
| Immigrants | Norway | 99.9 /100 | #45 | Exceptional 70.2% |
| Immigrants | Latvia | 99.9 /100 | #46 | Exceptional 70.1% |
| Immigrants | Bulgaria | 99.8 /100 | #47 | Exceptional 70.0% |
Demographics Similar to Immigrants from Croatia by College, Under 1 year
In terms of college, under 1 year, the demographic groups most similar to Immigrants from Croatia are Immigrants from Western Asia (67.8%, a difference of 0.010%), Afghan (67.8%, a difference of 0.010%), Austrian (67.8%, a difference of 0.060%), Palestinian (67.9%, a difference of 0.090%), and Carpatho Rusyn (67.9%, a difference of 0.090%).
| Demographics | Rating | Rank | College, Under 1 year |
| Immigrants | Bolivia | 97.0 /100 | #99 | Exceptional 67.9% |
| Immigrants | Argentina | 97.0 /100 | #100 | Exceptional 67.9% |
| Immigrants | Eastern Europe | 96.9 /100 | #101 | Exceptional 67.9% |
| Palestinians | 96.9 /100 | #102 | Exceptional 67.9% |
| Carpatho Rusyns | 96.8 /100 | #103 | Exceptional 67.9% |
| Immigrants | Western Asia | 96.6 /100 | #104 | Exceptional 67.8% |
| Afghans | 96.6 /100 | #105 | Exceptional 67.8% |
| Immigrants | Croatia | 96.6 /100 | #106 | Exceptional 67.8% |
| Austrians | 96.4 /100 | #107 | Exceptional 67.8% |
| Immigrants | Egypt | 96.0 /100 | #108 | Exceptional 67.7% |
| Scandinavians | 95.8 /100 | #109 | Exceptional 67.7% |
| Assyrians/Chaldeans/Syriacs | 95.8 /100 | #110 | Exceptional 67.7% |
| Ukrainians | 95.8 /100 | #111 | Exceptional 67.7% |
| Macedonians | 95.7 /100 | #112 | Exceptional 67.6% |
| Syrians | 95.6 /100 | #113 | Exceptional 67.6% |