Iroquois vs Immigrants from Croatia College, Under 1 year
COMPARE
Iroquois
Immigrants from Croatia
College, Under 1 year
College, Under 1 year Comparison
Iroquois
Immigrants from Croatia
62.6%
COLLEGE, UNDER 1 YEAR
2.0/ 100
METRIC RATING
233rd/ 347
METRIC RANK
67.8%
COLLEGE, UNDER 1 YEAR
96.6/ 100
METRIC RATING
106th/ 347
METRIC RANK
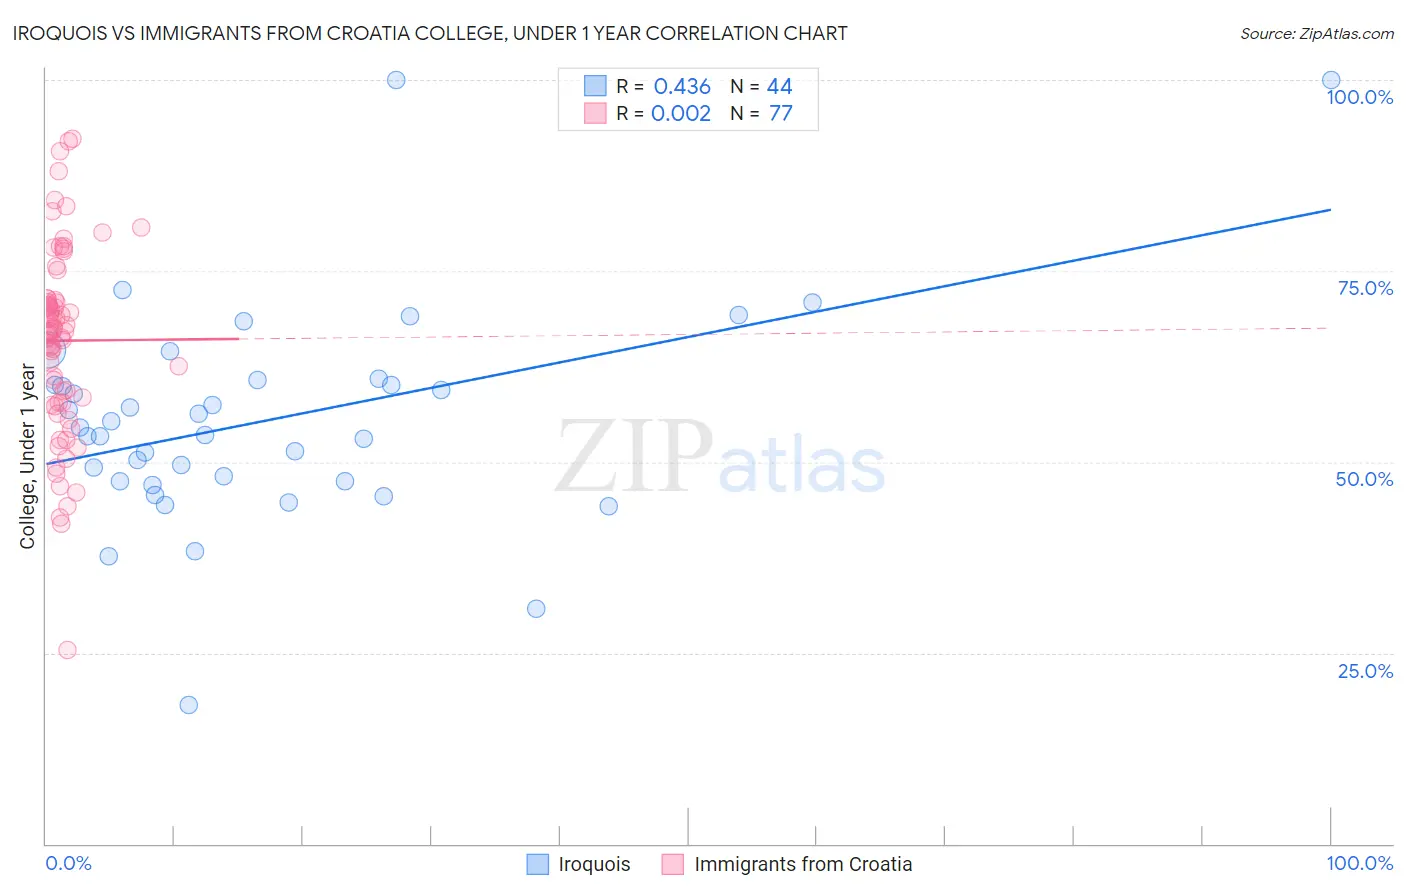
Iroquois vs Immigrants from Croatia College, Under 1 year Correlation Chart
The statistical analysis conducted on geographies consisting of 207,308,653 people shows a moderate positive correlation between the proportion of Iroquois and percentage of population with at least college, under 1 year education in the United States with a correlation coefficient (R) of 0.436 and weighted average of 62.6%. Similarly, the statistical analysis conducted on geographies consisting of 132,577,989 people shows no correlation between the proportion of Immigrants from Croatia and percentage of population with at least college, under 1 year education in the United States with a correlation coefficient (R) of 0.002 and weighted average of 67.8%, a difference of 8.3%.
College, Under 1 year Correlation Summary
| Measurement | Iroquois | Immigrants from Croatia |
| Minimum | 18.2% | 25.4% |
| Maximum | 100.0% | 92.2% |
| Range | 81.8% | 66.8% |
| Mean | 55.5% | 65.9% |
| Median | 54.0% | 67.1% |
| Interquartile 25% (IQ1) | 47.4% | 57.8% |
| Interquartile 75% (IQ3) | 60.4% | 71.3% |
| Interquartile Range (IQR) | 13.0% | 13.5% |
| Standard Deviation (Sample) | 14.4% | 12.3% |
| Standard Deviation (Population) | 14.3% | 12.3% |
Similar Demographics by College, Under 1 year
Demographics Similar to Iroquois by College, Under 1 year
In terms of college, under 1 year, the demographic groups most similar to Iroquois are Chippewa (62.6%, a difference of 0.030%), Spanish American (62.6%, a difference of 0.080%), Osage (62.7%, a difference of 0.12%), Immigrants (62.5%, a difference of 0.21%), and Immigrants from Western Africa (62.8%, a difference of 0.22%).
| Demographics | Rating | Rank | College, Under 1 year |
| Immigrants | Colombia | 4.0 /100 | #226 | Tragic 63.1% |
| Immigrants | Ghana | 3.7 /100 | #227 | Tragic 63.1% |
| Samoans | 3.3 /100 | #228 | Tragic 63.0% |
| Liberians | 3.2 /100 | #229 | Tragic 63.0% |
| Immigrants | Nonimmigrants | 3.0 /100 | #230 | Tragic 62.9% |
| Immigrants | Western Africa | 2.4 /100 | #231 | Tragic 62.8% |
| Osage | 2.2 /100 | #232 | Tragic 62.7% |
| Iroquois | 2.0 /100 | #233 | Tragic 62.6% |
| Chippewa | 2.0 /100 | #234 | Tragic 62.6% |
| Spanish Americans | 1.9 /100 | #235 | Tragic 62.6% |
| Immigrants | Immigrants | 1.7 /100 | #236 | Tragic 62.5% |
| Immigrants | Burma/Myanmar | 1.6 /100 | #237 | Tragic 62.5% |
| French American Indians | 1.5 /100 | #238 | Tragic 62.4% |
| Nepalese | 1.1 /100 | #239 | Tragic 62.2% |
| Aleuts | 1.1 /100 | #240 | Tragic 62.2% |
Demographics Similar to Immigrants from Croatia by College, Under 1 year
In terms of college, under 1 year, the demographic groups most similar to Immigrants from Croatia are Immigrants from Western Asia (67.8%, a difference of 0.010%), Afghan (67.8%, a difference of 0.010%), Austrian (67.8%, a difference of 0.060%), Palestinian (67.9%, a difference of 0.090%), and Carpatho Rusyn (67.9%, a difference of 0.090%).
| Demographics | Rating | Rank | College, Under 1 year |
| Immigrants | Bolivia | 97.0 /100 | #99 | Exceptional 67.9% |
| Immigrants | Argentina | 97.0 /100 | #100 | Exceptional 67.9% |
| Immigrants | Eastern Europe | 96.9 /100 | #101 | Exceptional 67.9% |
| Palestinians | 96.9 /100 | #102 | Exceptional 67.9% |
| Carpatho Rusyns | 96.8 /100 | #103 | Exceptional 67.9% |
| Immigrants | Western Asia | 96.6 /100 | #104 | Exceptional 67.8% |
| Afghans | 96.6 /100 | #105 | Exceptional 67.8% |
| Immigrants | Croatia | 96.6 /100 | #106 | Exceptional 67.8% |
| Austrians | 96.4 /100 | #107 | Exceptional 67.8% |
| Immigrants | Egypt | 96.0 /100 | #108 | Exceptional 67.7% |
| Scandinavians | 95.8 /100 | #109 | Exceptional 67.7% |
| Assyrians/Chaldeans/Syriacs | 95.8 /100 | #110 | Exceptional 67.7% |
| Ukrainians | 95.8 /100 | #111 | Exceptional 67.7% |
| Macedonians | 95.7 /100 | #112 | Exceptional 67.6% |
| Syrians | 95.6 /100 | #113 | Exceptional 67.6% |