Immigrants from Southern Europe vs Immigrants from Croatia College, Under 1 year
COMPARE
Immigrants from Southern Europe
Immigrants from Croatia
College, Under 1 year
College, Under 1 year Comparison
Immigrants from Southern Europe
Immigrants from Croatia
64.9%
COLLEGE, UNDER 1 YEAR
34.3/ 100
METRIC RATING
187th/ 347
METRIC RANK
67.8%
COLLEGE, UNDER 1 YEAR
96.6/ 100
METRIC RATING
106th/ 347
METRIC RANK
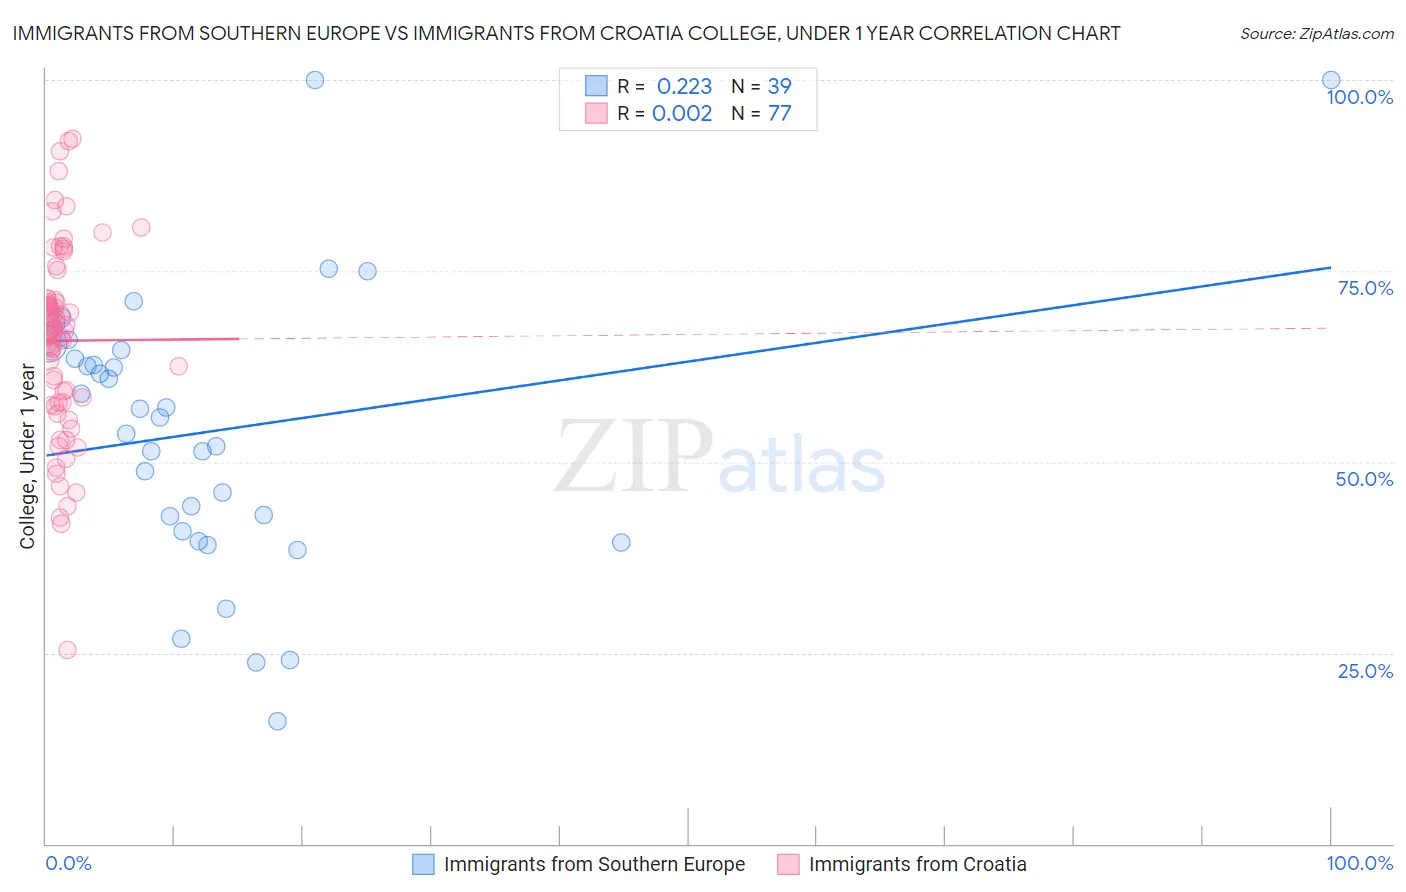
Immigrants from Southern Europe vs Immigrants from Croatia College, Under 1 year Correlation Chart
The statistical analysis conducted on geographies consisting of 402,801,573 people shows a weak positive correlation between the proportion of Immigrants from Southern Europe and percentage of population with at least college, under 1 year education in the United States with a correlation coefficient (R) of 0.223 and weighted average of 64.9%. Similarly, the statistical analysis conducted on geographies consisting of 132,577,989 people shows no correlation between the proportion of Immigrants from Croatia and percentage of population with at least college, under 1 year education in the United States with a correlation coefficient (R) of 0.002 and weighted average of 67.8%, a difference of 4.4%.
College, Under 1 year Correlation Summary
| Measurement | Immigrants from Southern Europe | Immigrants from Croatia |
| Minimum | 16.1% | 25.4% |
| Maximum | 100.0% | 92.2% |
| Range | 83.9% | 66.8% |
| Mean | 54.1% | 65.9% |
| Median | 55.8% | 67.1% |
| Interquartile 25% (IQ1) | 40.9% | 57.8% |
| Interquartile 75% (IQ3) | 64.6% | 71.3% |
| Interquartile Range (IQR) | 23.6% | 13.5% |
| Standard Deviation (Sample) | 18.3% | 12.3% |
| Standard Deviation (Population) | 18.1% | 12.3% |
Similar Demographics by College, Under 1 year
Demographics Similar to Immigrants from Southern Europe by College, Under 1 year
In terms of college, under 1 year, the demographic groups most similar to Immigrants from Southern Europe are Immigrants from Albania (64.9%, a difference of 0.11%), Spanish (64.9%, a difference of 0.14%), Immigrants from Philippines (64.8%, a difference of 0.21%), Immigrants from Sierra Leone (65.1%, a difference of 0.26%), and Immigrants from Armenia (64.7%, a difference of 0.32%).
| Demographics | Rating | Rank | College, Under 1 year |
| Dutch | 46.1 /100 | #180 | Average 65.3% |
| Spaniards | 45.5 /100 | #181 | Average 65.3% |
| Immigrants | Africa | 44.7 /100 | #182 | Average 65.3% |
| Immigrants | Poland | 42.6 /100 | #183 | Average 65.2% |
| Bermudans | 42.0 /100 | #184 | Average 65.2% |
| Sri Lankans | 41.7 /100 | #185 | Average 65.2% |
| Immigrants | Sierra Leone | 39.7 /100 | #186 | Fair 65.1% |
| Immigrants | Southern Europe | 34.3 /100 | #187 | Fair 64.9% |
| Immigrants | Albania | 32.0 /100 | #188 | Fair 64.9% |
| Spanish | 31.6 /100 | #189 | Fair 64.9% |
| Immigrants | Philippines | 30.1 /100 | #190 | Fair 64.8% |
| Immigrants | Armenia | 28.1 /100 | #191 | Fair 64.7% |
| Immigrants | Thailand | 27.0 /100 | #192 | Fair 64.7% |
| Slovaks | 26.7 /100 | #193 | Fair 64.7% |
| Immigrants | Cameroon | 24.6 /100 | #194 | Fair 64.6% |
Demographics Similar to Immigrants from Croatia by College, Under 1 year
In terms of college, under 1 year, the demographic groups most similar to Immigrants from Croatia are Immigrants from Western Asia (67.8%, a difference of 0.010%), Afghan (67.8%, a difference of 0.010%), Austrian (67.8%, a difference of 0.060%), Palestinian (67.9%, a difference of 0.090%), and Carpatho Rusyn (67.9%, a difference of 0.090%).
| Demographics | Rating | Rank | College, Under 1 year |
| Immigrants | Bolivia | 97.0 /100 | #99 | Exceptional 67.9% |
| Immigrants | Argentina | 97.0 /100 | #100 | Exceptional 67.9% |
| Immigrants | Eastern Europe | 96.9 /100 | #101 | Exceptional 67.9% |
| Palestinians | 96.9 /100 | #102 | Exceptional 67.9% |
| Carpatho Rusyns | 96.8 /100 | #103 | Exceptional 67.9% |
| Immigrants | Western Asia | 96.6 /100 | #104 | Exceptional 67.8% |
| Afghans | 96.6 /100 | #105 | Exceptional 67.8% |
| Immigrants | Croatia | 96.6 /100 | #106 | Exceptional 67.8% |
| Austrians | 96.4 /100 | #107 | Exceptional 67.8% |
| Immigrants | Egypt | 96.0 /100 | #108 | Exceptional 67.7% |
| Scandinavians | 95.8 /100 | #109 | Exceptional 67.7% |
| Assyrians/Chaldeans/Syriacs | 95.8 /100 | #110 | Exceptional 67.7% |
| Ukrainians | 95.8 /100 | #111 | Exceptional 67.7% |
| Macedonians | 95.7 /100 | #112 | Exceptional 67.6% |
| Syrians | 95.6 /100 | #113 | Exceptional 67.6% |