Portuguese vs European College, 1 year or more
COMPARE
Portuguese
European
College, 1 year or more
College, 1 year or more Comparison
Portuguese
Europeans
57.2%
COLLEGE, 1 YEAR OR MORE
5.4/ 100
METRIC RATING
223rd/ 347
METRIC RANK
61.8%
COLLEGE, 1 YEAR OR MORE
95.6/ 100
METRIC RATING
110th/ 347
METRIC RANK
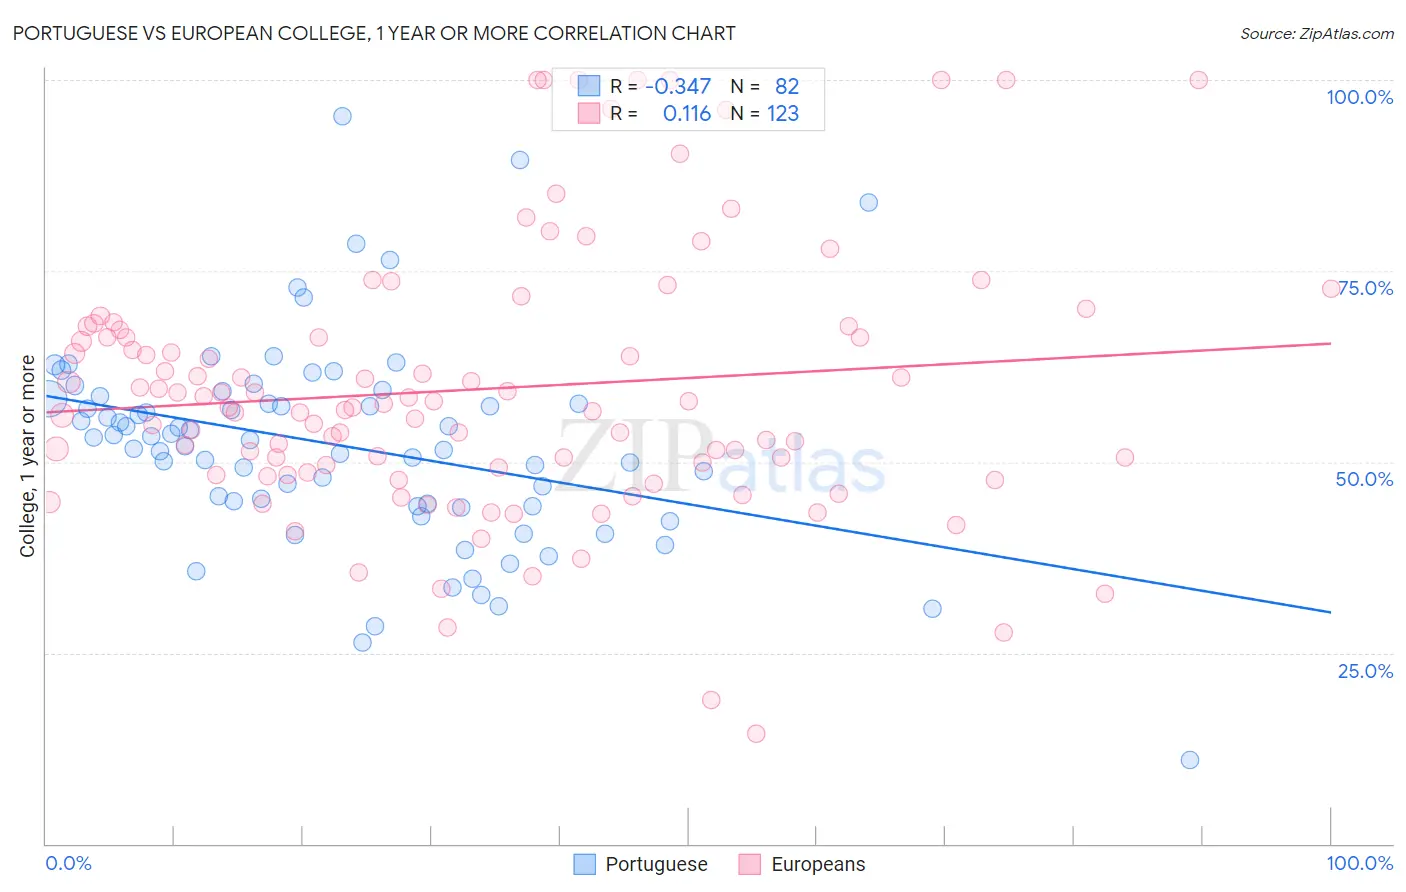
Portuguese vs European College, 1 year or more Correlation Chart
The statistical analysis conducted on geographies consisting of 450,364,670 people shows a mild negative correlation between the proportion of Portuguese and percentage of population with at least college, 1 year or more education in the United States with a correlation coefficient (R) of -0.347 and weighted average of 57.2%. Similarly, the statistical analysis conducted on geographies consisting of 561,821,081 people shows a poor positive correlation between the proportion of Europeans and percentage of population with at least college, 1 year or more education in the United States with a correlation coefficient (R) of 0.116 and weighted average of 61.8%, a difference of 8.2%.
College, 1 year or more Correlation Summary
| Measurement | Portuguese | European |
| Minimum | 11.0% | 14.4% |
| Maximum | 95.3% | 100.0% |
| Range | 84.4% | 85.6% |
| Mean | 52.1% | 59.5% |
| Median | 53.0% | 57.2% |
| Interquartile 25% (IQ1) | 44.2% | 48.7% |
| Interquartile 75% (IQ3) | 58.2% | 67.3% |
| Interquartile Range (IQR) | 14.0% | 18.6% |
| Standard Deviation (Sample) | 13.6% | 17.4% |
| Standard Deviation (Population) | 13.5% | 17.3% |
Similar Demographics by College, 1 year or more
Demographics Similar to Portuguese by College, 1 year or more
In terms of college, 1 year or more, the demographic groups most similar to Portuguese are Hmong (57.2%, a difference of 0.0%), Subsaharan African (57.3%, a difference of 0.17%), Vietnamese (57.0%, a difference of 0.21%), Immigrants from Western Africa (57.0%, a difference of 0.23%), and Immigrants (57.0%, a difference of 0.30%).
| Demographics | Rating | Rank | College, 1 year or more |
| Immigrants | Peru | 10.6 /100 | #216 | Poor 57.7% |
| Immigrants | Panama | 9.1 /100 | #217 | Tragic 57.6% |
| Native Hawaiians | 9.0 /100 | #218 | Tragic 57.6% |
| Whites/Caucasians | 8.7 /100 | #219 | Tragic 57.6% |
| Immigrants | Costa Rica | 8.0 /100 | #220 | Tragic 57.5% |
| Immigrants | Ghana | 7.7 /100 | #221 | Tragic 57.4% |
| Sub-Saharan Africans | 6.1 /100 | #222 | Tragic 57.3% |
| Portuguese | 5.4 /100 | #223 | Tragic 57.2% |
| Hmong | 5.4 /100 | #224 | Tragic 57.2% |
| Vietnamese | 4.7 /100 | #225 | Tragic 57.0% |
| Immigrants | Western Africa | 4.6 /100 | #226 | Tragic 57.0% |
| Immigrants | Immigrants | 4.4 /100 | #227 | Tragic 57.0% |
| Immigrants | Fiji | 4.0 /100 | #228 | Tragic 56.9% |
| Cree | 3.6 /100 | #229 | Tragic 56.8% |
| Liberians | 3.1 /100 | #230 | Tragic 56.7% |
Demographics Similar to Europeans by College, 1 year or more
In terms of college, 1 year or more, the demographic groups most similar to Europeans are Macedonian (61.8%, a difference of 0.0%), Syrian (61.9%, a difference of 0.020%), Immigrants from Northern Africa (61.9%, a difference of 0.020%), Immigrants from Ukraine (61.9%, a difference of 0.040%), and Austrian (61.8%, a difference of 0.060%).
| Demographics | Rating | Rank | College, 1 year or more |
| Afghans | 96.4 /100 | #103 | Exceptional 62.0% |
| Chileans | 96.4 /100 | #104 | Exceptional 62.0% |
| Immigrants | Nepal | 96.3 /100 | #105 | Exceptional 62.0% |
| Palestinians | 96.3 /100 | #106 | Exceptional 62.0% |
| Immigrants | Ukraine | 95.8 /100 | #107 | Exceptional 61.9% |
| Syrians | 95.7 /100 | #108 | Exceptional 61.9% |
| Immigrants | Northern Africa | 95.7 /100 | #109 | Exceptional 61.9% |
| Europeans | 95.6 /100 | #110 | Exceptional 61.8% |
| Macedonians | 95.6 /100 | #111 | Exceptional 61.8% |
| Austrians | 95.4 /100 | #112 | Exceptional 61.8% |
| Ukrainians | 95.2 /100 | #113 | Exceptional 61.8% |
| Danes | 94.8 /100 | #114 | Exceptional 61.7% |
| Norwegians | 94.5 /100 | #115 | Exceptional 61.7% |
| Lebanese | 94.1 /100 | #116 | Exceptional 61.6% |
| Arabs | 93.9 /100 | #117 | Exceptional 61.6% |