Polish vs Czechoslovakian Doctorate Degree
COMPARE
Polish
Czechoslovakian
Doctorate Degree
Doctorate Degree Comparison
Poles
Czechoslovakians
1.9%
DOCTORATE DEGREE
72.7/ 100
METRIC RATING
155th/ 347
METRIC RANK
1.8%
DOCTORATE DEGREE
33.0/ 100
METRIC RATING
187th/ 347
METRIC RANK
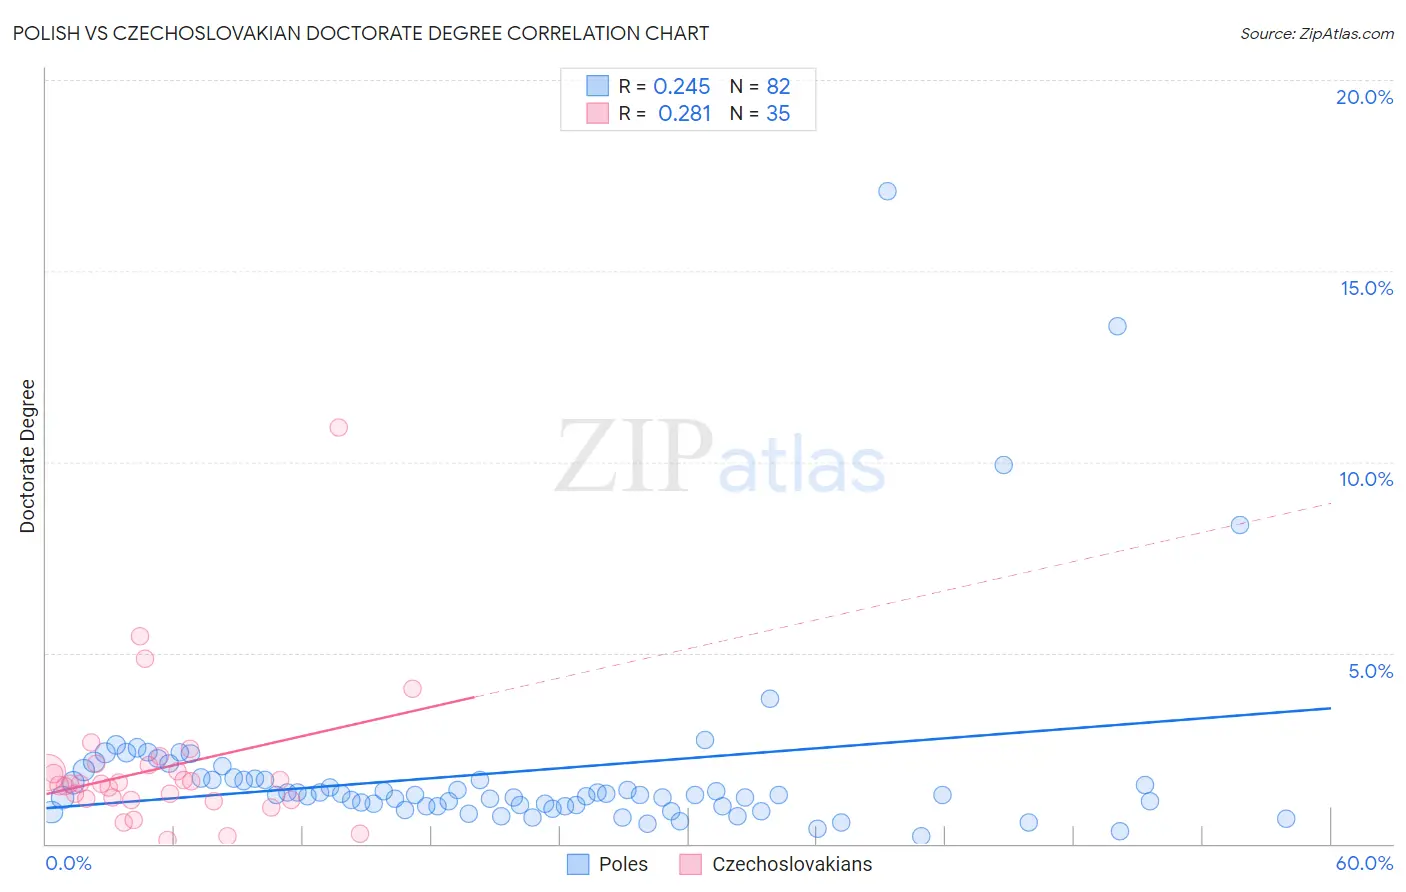
Polish vs Czechoslovakian Doctorate Degree Correlation Chart
The statistical analysis conducted on geographies consisting of 539,143,774 people shows a weak positive correlation between the proportion of Poles and percentage of population with at least doctorate degree education in the United States with a correlation coefficient (R) of 0.245 and weighted average of 1.9%. Similarly, the statistical analysis conducted on geographies consisting of 364,136,650 people shows a weak positive correlation between the proportion of Czechoslovakians and percentage of population with at least doctorate degree education in the United States with a correlation coefficient (R) of 0.281 and weighted average of 1.8%, a difference of 6.3%.
Doctorate Degree Correlation Summary
| Measurement | Polish | Czechoslovakian |
| Minimum | 0.20% | 0.10% |
| Maximum | 17.1% | 10.9% |
| Range | 16.9% | 10.8% |
| Mean | 1.9% | 2.0% |
| Median | 1.3% | 1.6% |
| Interquartile 25% (IQ1) | 0.98% | 1.1% |
| Interquartile 75% (IQ3) | 1.7% | 2.1% |
| Interquartile Range (IQR) | 0.71% | 0.92% |
| Standard Deviation (Sample) | 2.5% | 1.9% |
| Standard Deviation (Population) | 2.5% | 1.9% |
Similar Demographics by Doctorate Degree
Demographics Similar to Poles by Doctorate Degree
In terms of doctorate degree, the demographic groups most similar to Poles are Immigrants from Albania (1.9%, a difference of 0.020%), Slavic (1.9%, a difference of 0.060%), Danish (1.9%, a difference of 0.14%), Hungarian (1.9%, a difference of 0.17%), and Immigrants from Oceania (1.9%, a difference of 0.24%).
| Demographics | Rating | Rank | Doctorate Degree |
| Luxembourgers | 81.1 /100 | #148 | Excellent 1.9% |
| Basques | 76.9 /100 | #149 | Good 1.9% |
| English | 75.9 /100 | #150 | Good 1.9% |
| Albanians | 74.8 /100 | #151 | Good 1.9% |
| Immigrants | Kenya | 74.3 /100 | #152 | Good 1.9% |
| Immigrants | Oceania | 74.0 /100 | #153 | Good 1.9% |
| Immigrants | Albania | 72.8 /100 | #154 | Good 1.9% |
| Poles | 72.7 /100 | #155 | Good 1.9% |
| Slavs | 72.4 /100 | #156 | Good 1.9% |
| Danes | 71.9 /100 | #157 | Good 1.9% |
| Hungarians | 71.7 /100 | #158 | Good 1.9% |
| Slovenes | 70.2 /100 | #159 | Good 1.9% |
| Welsh | 69.7 /100 | #160 | Good 1.9% |
| Immigrants | Middle Africa | 68.8 /100 | #161 | Good 1.9% |
| Irish | 67.5 /100 | #162 | Good 1.9% |
Demographics Similar to Czechoslovakians by Doctorate Degree
In terms of doctorate degree, the demographic groups most similar to Czechoslovakians are Peruvian (1.8%, a difference of 0.23%), German (1.8%, a difference of 0.45%), French Canadian (1.8%, a difference of 0.49%), Immigrants from Costa Rica (1.8%, a difference of 0.50%), and Slovak (1.8%, a difference of 0.55%).
| Demographics | Rating | Rank | Doctorate Degree |
| Scandinavians | 48.0 /100 | #180 | Average 1.8% |
| Immigrants | Immigrants | 46.2 /100 | #181 | Average 1.8% |
| Immigrants | Afghanistan | 44.3 /100 | #182 | Average 1.8% |
| Finns | 42.1 /100 | #183 | Average 1.8% |
| Nigerians | 39.9 /100 | #184 | Fair 1.8% |
| Slovaks | 36.4 /100 | #185 | Fair 1.8% |
| Peruvians | 34.4 /100 | #186 | Fair 1.8% |
| Czechoslovakians | 33.0 /100 | #187 | Fair 1.8% |
| Germans | 30.5 /100 | #188 | Fair 1.8% |
| French Canadians | 30.2 /100 | #189 | Fair 1.8% |
| Immigrants | Costa Rica | 30.2 /100 | #190 | Fair 1.8% |
| South Americans | 29.5 /100 | #191 | Fair 1.8% |
| Dutch | 27.4 /100 | #192 | Fair 1.8% |
| German Russians | 27.1 /100 | #193 | Fair 1.8% |
| Uruguayans | 26.2 /100 | #194 | Fair 1.8% |