Polish vs Immigrants from Uganda Doctorate Degree
COMPARE
Polish
Immigrants from Uganda
Doctorate Degree
Doctorate Degree Comparison
Poles
Immigrants from Uganda
1.9%
DOCTORATE DEGREE
72.7/ 100
METRIC RATING
155th/ 347
METRIC RANK
2.2%
DOCTORATE DEGREE
99.6/ 100
METRIC RATING
82nd/ 347
METRIC RANK
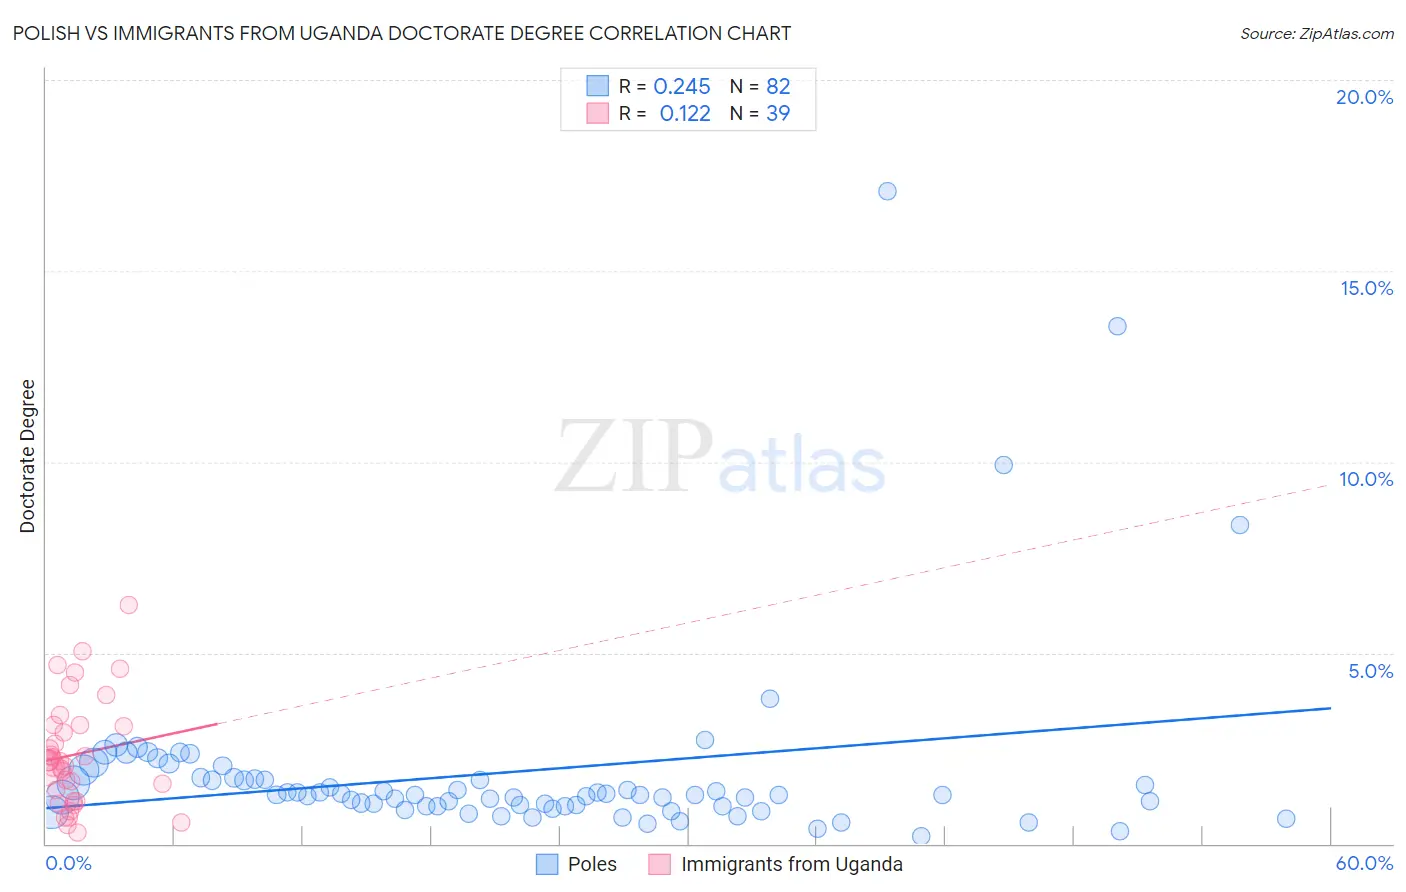
Polish vs Immigrants from Uganda Doctorate Degree Correlation Chart
The statistical analysis conducted on geographies consisting of 539,143,774 people shows a weak positive correlation between the proportion of Poles and percentage of population with at least doctorate degree education in the United States with a correlation coefficient (R) of 0.245 and weighted average of 1.9%. Similarly, the statistical analysis conducted on geographies consisting of 125,795,140 people shows a poor positive correlation between the proportion of Immigrants from Uganda and percentage of population with at least doctorate degree education in the United States with a correlation coefficient (R) of 0.122 and weighted average of 2.2%, a difference of 16.2%.
Doctorate Degree Correlation Summary
| Measurement | Polish | Immigrants from Uganda |
| Minimum | 0.20% | 0.28% |
| Maximum | 17.1% | 6.2% |
| Range | 16.9% | 6.0% |
| Mean | 1.9% | 2.3% |
| Median | 1.3% | 2.2% |
| Interquartile 25% (IQ1) | 0.98% | 1.1% |
| Interquartile 75% (IQ3) | 1.7% | 3.1% |
| Interquartile Range (IQR) | 0.71% | 2.0% |
| Standard Deviation (Sample) | 2.5% | 1.4% |
| Standard Deviation (Population) | 2.5% | 1.4% |
Similar Demographics by Doctorate Degree
Demographics Similar to Poles by Doctorate Degree
In terms of doctorate degree, the demographic groups most similar to Poles are Immigrants from Albania (1.9%, a difference of 0.020%), Slavic (1.9%, a difference of 0.060%), Danish (1.9%, a difference of 0.14%), Hungarian (1.9%, a difference of 0.17%), and Immigrants from Oceania (1.9%, a difference of 0.24%).
| Demographics | Rating | Rank | Doctorate Degree |
| Luxembourgers | 81.1 /100 | #148 | Excellent 1.9% |
| Basques | 76.9 /100 | #149 | Good 1.9% |
| English | 75.9 /100 | #150 | Good 1.9% |
| Albanians | 74.8 /100 | #151 | Good 1.9% |
| Immigrants | Kenya | 74.3 /100 | #152 | Good 1.9% |
| Immigrants | Oceania | 74.0 /100 | #153 | Good 1.9% |
| Immigrants | Albania | 72.8 /100 | #154 | Good 1.9% |
| Poles | 72.7 /100 | #155 | Good 1.9% |
| Slavs | 72.4 /100 | #156 | Good 1.9% |
| Danes | 71.9 /100 | #157 | Good 1.9% |
| Hungarians | 71.7 /100 | #158 | Good 1.9% |
| Slovenes | 70.2 /100 | #159 | Good 1.9% |
| Welsh | 69.7 /100 | #160 | Good 1.9% |
| Immigrants | Middle Africa | 68.8 /100 | #161 | Good 1.9% |
| Irish | 67.5 /100 | #162 | Good 1.9% |
Demographics Similar to Immigrants from Uganda by Doctorate Degree
In terms of doctorate degree, the demographic groups most similar to Immigrants from Uganda are Immigrants from Lithuania (2.2%, a difference of 0.17%), Immigrants from England (2.2%, a difference of 0.32%), Immigrants from Brazil (2.2%, a difference of 0.45%), Immigrants from Argentina (2.2%, a difference of 0.54%), and Ugandan (2.2%, a difference of 0.59%).
| Demographics | Rating | Rank | Doctorate Degree |
| Immigrants | Western Asia | 99.8 /100 | #75 | Exceptional 2.2% |
| Immigrants | Hungary | 99.8 /100 | #76 | Exceptional 2.2% |
| Immigrants | Lebanon | 99.8 /100 | #77 | Exceptional 2.2% |
| Immigrants | Belarus | 99.7 /100 | #78 | Exceptional 2.2% |
| Northern Europeans | 99.7 /100 | #79 | Exceptional 2.2% |
| Ugandans | 99.7 /100 | #80 | Exceptional 2.2% |
| Immigrants | Argentina | 99.7 /100 | #81 | Exceptional 2.2% |
| Immigrants | Uganda | 99.6 /100 | #82 | Exceptional 2.2% |
| Immigrants | Lithuania | 99.6 /100 | #83 | Exceptional 2.2% |
| Immigrants | England | 99.6 /100 | #84 | Exceptional 2.2% |
| Immigrants | Brazil | 99.6 /100 | #85 | Exceptional 2.2% |
| Egyptians | 99.4 /100 | #86 | Exceptional 2.2% |
| Immigrants | Zimbabwe | 99.4 /100 | #87 | Exceptional 2.2% |
| Immigrants | Nepal | 99.3 /100 | #88 | Exceptional 2.2% |
| British | 99.3 /100 | #89 | Exceptional 2.2% |