Polish vs Scandinavian Associate's Degree
COMPARE
Polish
Scandinavian
Associate's Degree
Associate's Degree Comparison
Poles
Scandinavians
48.0%
ASSOCIATE'S DEGREE
87.3/ 100
METRIC RATING
138th/ 347
METRIC RANK
46.9%
ASSOCIATE'S DEGREE
65.2/ 100
METRIC RATING
161st/ 347
METRIC RANK
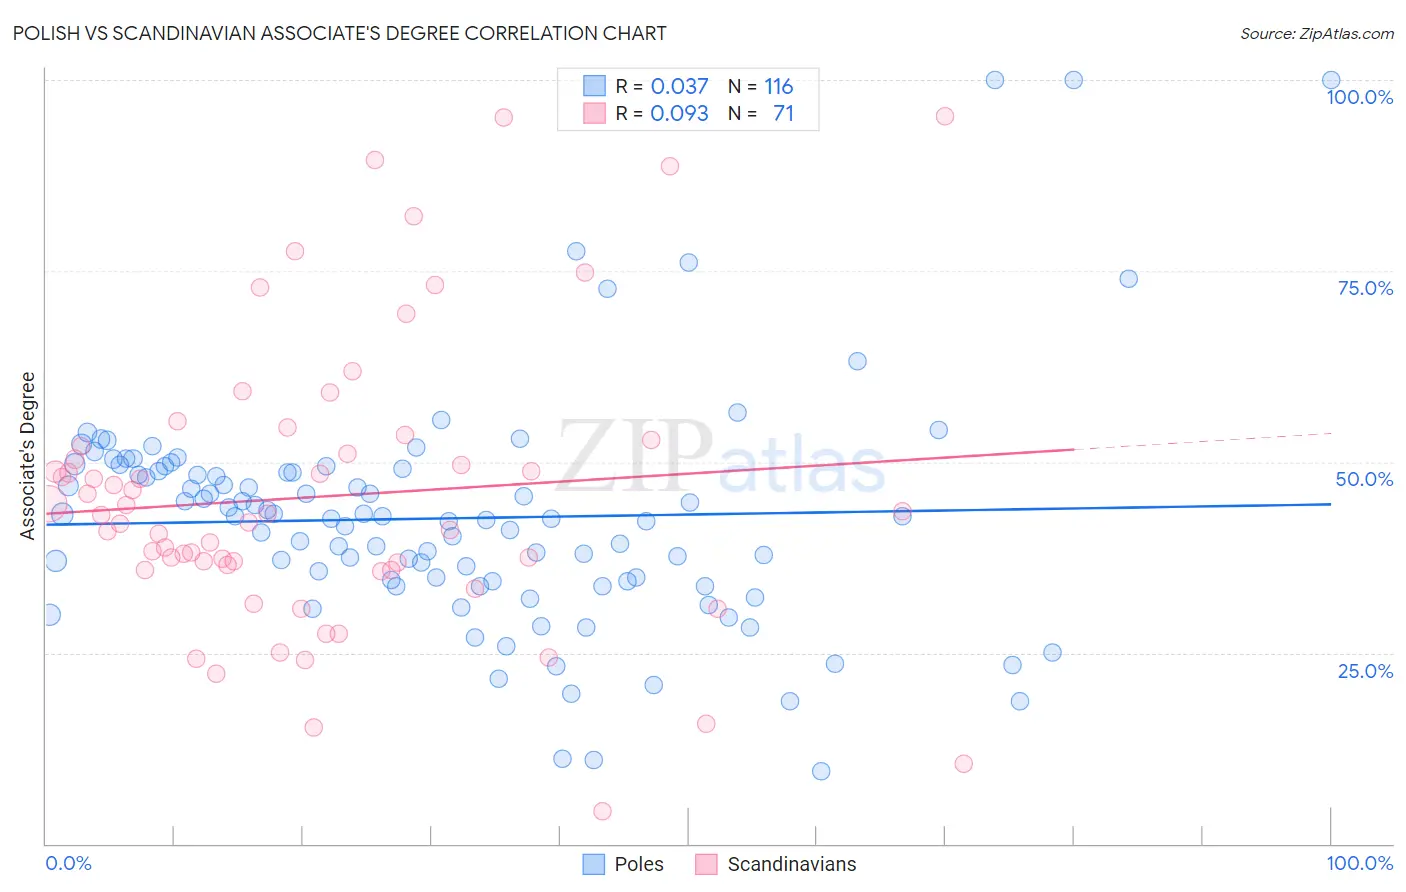
Polish vs Scandinavian Associate's Degree Correlation Chart
The statistical analysis conducted on geographies consisting of 560,512,147 people shows no correlation between the proportion of Poles and percentage of population with at least associate's degree education in the United States with a correlation coefficient (R) of 0.037 and weighted average of 48.0%. Similarly, the statistical analysis conducted on geographies consisting of 472,632,829 people shows a slight positive correlation between the proportion of Scandinavians and percentage of population with at least associate's degree education in the United States with a correlation coefficient (R) of 0.093 and weighted average of 46.9%, a difference of 2.4%.
Associate's Degree Correlation Summary
| Measurement | Polish | Scandinavian |
| Minimum | 9.5% | 4.2% |
| Maximum | 100.0% | 95.2% |
| Range | 90.5% | 91.0% |
| Mean | 42.6% | 45.5% |
| Median | 42.7% | 43.1% |
| Interquartile 25% (IQ1) | 34.4% | 35.9% |
| Interquartile 75% (IQ3) | 48.9% | 52.1% |
| Interquartile Range (IQR) | 14.5% | 16.2% |
| Standard Deviation (Sample) | 15.3% | 18.8% |
| Standard Deviation (Population) | 15.2% | 18.7% |
Similar Demographics by Associate's Degree
Demographics Similar to Poles by Associate's Degree
In terms of associate's degree, the demographic groups most similar to Poles are Immigrants from Eritrea (48.1%, a difference of 0.070%), Pakistani (48.1%, a difference of 0.11%), European (48.2%, a difference of 0.29%), Moroccan (48.2%, a difference of 0.35%), and Slovene (47.9%, a difference of 0.35%).
| Demographics | Rating | Rank | Associate's Degree |
| Icelanders | 90.8 /100 | #131 | Exceptional 48.3% |
| Immigrants | Albania | 89.9 /100 | #132 | Excellent 48.2% |
| Assyrians/Chaldeans/Syriacs | 89.4 /100 | #133 | Excellent 48.2% |
| Moroccans | 89.3 /100 | #134 | Excellent 48.2% |
| Europeans | 89.0 /100 | #135 | Excellent 48.2% |
| Pakistanis | 88.0 /100 | #136 | Excellent 48.1% |
| Immigrants | Eritrea | 87.8 /100 | #137 | Excellent 48.1% |
| Poles | 87.3 /100 | #138 | Excellent 48.0% |
| Slovenes | 85.1 /100 | #139 | Excellent 47.9% |
| Immigrants | Southern Europe | 84.4 /100 | #140 | Excellent 47.8% |
| Taiwanese | 83.3 /100 | #141 | Excellent 47.7% |
| Sierra Leoneans | 82.9 /100 | #142 | Excellent 47.7% |
| Norwegians | 81.0 /100 | #143 | Excellent 47.6% |
| Slavs | 80.5 /100 | #144 | Excellent 47.6% |
| Canadians | 79.0 /100 | #145 | Good 47.5% |
Demographics Similar to Scandinavians by Associate's Degree
In terms of associate's degree, the demographic groups most similar to Scandinavians are Scottish (46.9%, a difference of 0.020%), Immigrants from Africa (46.8%, a difference of 0.16%), Somali (46.8%, a difference of 0.22%), Colombian (46.8%, a difference of 0.23%), and Immigrants from Poland (47.1%, a difference of 0.33%).
| Demographics | Rating | Rank | Associate's Degree |
| Immigrants | Kenya | 72.1 /100 | #154 | Good 47.2% |
| Kenyans | 70.6 /100 | #155 | Good 47.1% |
| South Americans | 70.5 /100 | #156 | Good 47.1% |
| Sudanese | 70.3 /100 | #157 | Good 47.1% |
| Immigrants | Germany | 69.7 /100 | #158 | Good 47.1% |
| Immigrants | Poland | 69.2 /100 | #159 | Good 47.1% |
| Scottish | 65.4 /100 | #160 | Good 46.9% |
| Scandinavians | 65.2 /100 | #161 | Good 46.9% |
| Immigrants | Africa | 63.2 /100 | #162 | Good 46.8% |
| Somalis | 62.5 /100 | #163 | Good 46.8% |
| Colombians | 62.4 /100 | #164 | Good 46.8% |
| Immigrants | South America | 59.9 /100 | #165 | Average 46.7% |
| Hungarians | 59.3 /100 | #166 | Average 46.7% |
| Immigrants | Sierra Leone | 59.2 /100 | #167 | Average 46.7% |
| Immigrants | Somalia | 55.5 /100 | #168 | Average 46.5% |