Immigrants from Hong Kong vs Scandinavian Associate's Degree
COMPARE
Immigrants from Hong Kong
Scandinavian
Associate's Degree
Associate's Degree Comparison
Immigrants from Hong Kong
Scandinavians
55.4%
ASSOCIATE'S DEGREE
100.0/ 100
METRIC RATING
14th/ 347
METRIC RANK
46.9%
ASSOCIATE'S DEGREE
65.2/ 100
METRIC RATING
161st/ 347
METRIC RANK
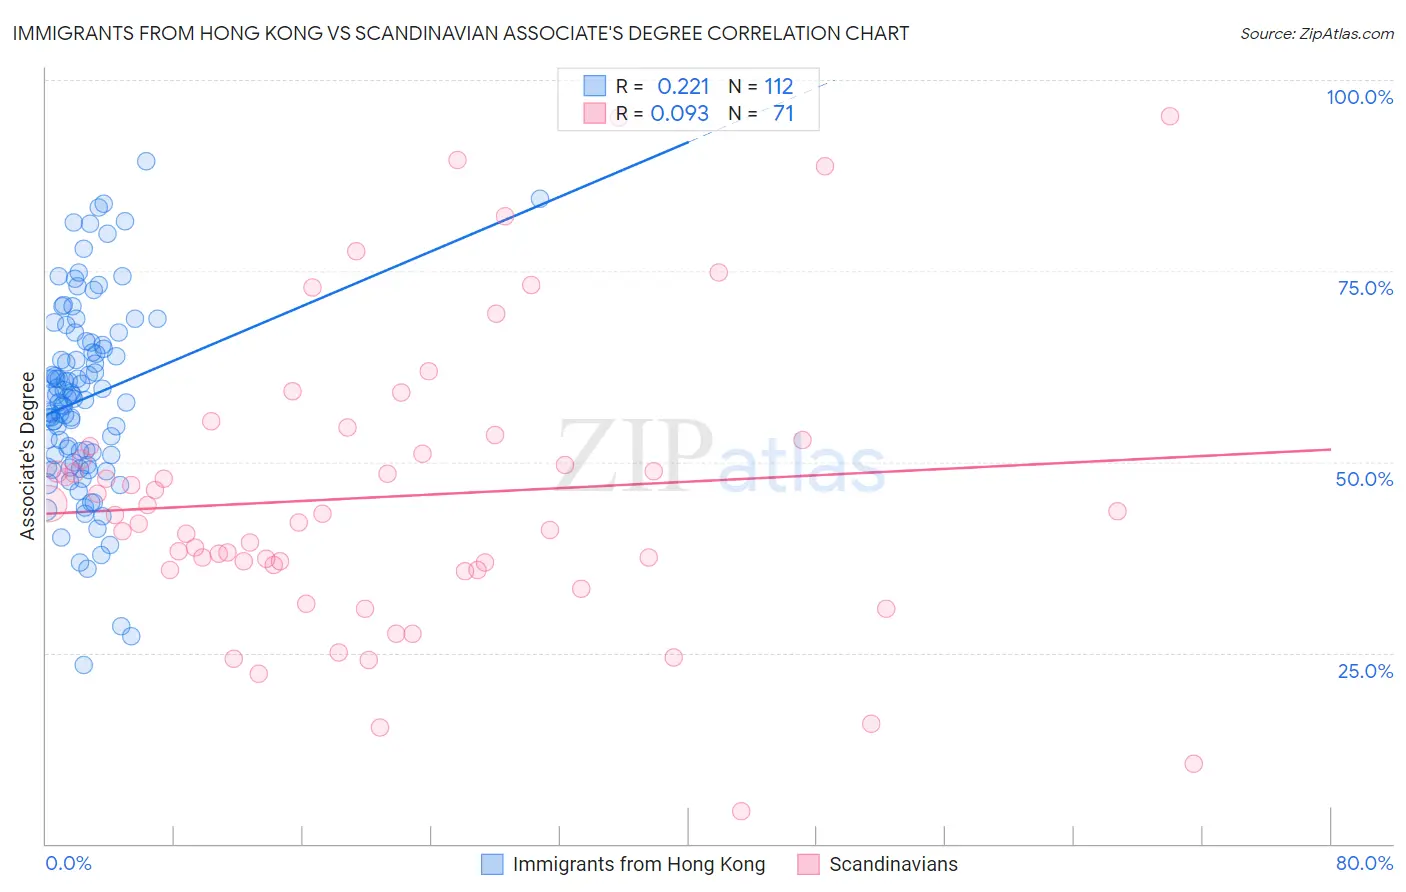
Immigrants from Hong Kong vs Scandinavian Associate's Degree Correlation Chart
The statistical analysis conducted on geographies consisting of 253,990,250 people shows a weak positive correlation between the proportion of Immigrants from Hong Kong and percentage of population with at least associate's degree education in the United States with a correlation coefficient (R) of 0.221 and weighted average of 55.4%. Similarly, the statistical analysis conducted on geographies consisting of 472,632,829 people shows a slight positive correlation between the proportion of Scandinavians and percentage of population with at least associate's degree education in the United States with a correlation coefficient (R) of 0.093 and weighted average of 46.9%, a difference of 18.1%.
Associate's Degree Correlation Summary
| Measurement | Immigrants from Hong Kong | Scandinavian |
| Minimum | 23.3% | 4.2% |
| Maximum | 89.4% | 95.2% |
| Range | 66.0% | 91.0% |
| Mean | 58.3% | 45.5% |
| Median | 58.4% | 43.1% |
| Interquartile 25% (IQ1) | 50.4% | 35.9% |
| Interquartile 75% (IQ3) | 65.4% | 52.1% |
| Interquartile Range (IQR) | 15.1% | 16.2% |
| Standard Deviation (Sample) | 12.4% | 18.8% |
| Standard Deviation (Population) | 12.4% | 18.7% |
Similar Demographics by Associate's Degree
Demographics Similar to Immigrants from Hong Kong by Associate's Degree
In terms of associate's degree, the demographic groups most similar to Immigrants from Hong Kong are Immigrants from Eastern Asia (55.4%, a difference of 0.030%), Immigrants from China (55.5%, a difference of 0.14%), Soviet Union (55.1%, a difference of 0.50%), Immigrants from South Central Asia (55.7%, a difference of 0.63%), and Eastern European (55.0%, a difference of 0.64%).
| Demographics | Rating | Rank | Associate's Degree |
| Immigrants | Iran | 100.0 /100 | #7 | Exceptional 57.7% |
| Thais | 100.0 /100 | #8 | Exceptional 57.4% |
| Immigrants | Israel | 100.0 /100 | #9 | Exceptional 56.8% |
| Cypriots | 100.0 /100 | #10 | Exceptional 56.4% |
| Immigrants | Australia | 100.0 /100 | #11 | Exceptional 55.8% |
| Immigrants | South Central Asia | 100.0 /100 | #12 | Exceptional 55.7% |
| Immigrants | China | 100.0 /100 | #13 | Exceptional 55.5% |
| Immigrants | Hong Kong | 100.0 /100 | #14 | Exceptional 55.4% |
| Immigrants | Eastern Asia | 100.0 /100 | #15 | Exceptional 55.4% |
| Soviet Union | 100.0 /100 | #16 | Exceptional 55.1% |
| Eastern Europeans | 100.0 /100 | #17 | Exceptional 55.0% |
| Indians (Asian) | 100.0 /100 | #18 | Exceptional 54.8% |
| Immigrants | Ireland | 100.0 /100 | #19 | Exceptional 54.7% |
| Cambodians | 100.0 /100 | #20 | Exceptional 54.6% |
| Immigrants | Sweden | 100.0 /100 | #21 | Exceptional 54.6% |
Demographics Similar to Scandinavians by Associate's Degree
In terms of associate's degree, the demographic groups most similar to Scandinavians are Scottish (46.9%, a difference of 0.020%), Immigrants from Africa (46.8%, a difference of 0.16%), Somali (46.8%, a difference of 0.22%), Colombian (46.8%, a difference of 0.23%), and Immigrants from Poland (47.1%, a difference of 0.33%).
| Demographics | Rating | Rank | Associate's Degree |
| Immigrants | Kenya | 72.1 /100 | #154 | Good 47.2% |
| Kenyans | 70.6 /100 | #155 | Good 47.1% |
| South Americans | 70.5 /100 | #156 | Good 47.1% |
| Sudanese | 70.3 /100 | #157 | Good 47.1% |
| Immigrants | Germany | 69.7 /100 | #158 | Good 47.1% |
| Immigrants | Poland | 69.2 /100 | #159 | Good 47.1% |
| Scottish | 65.4 /100 | #160 | Good 46.9% |
| Scandinavians | 65.2 /100 | #161 | Good 46.9% |
| Immigrants | Africa | 63.2 /100 | #162 | Good 46.8% |
| Somalis | 62.5 /100 | #163 | Good 46.8% |
| Colombians | 62.4 /100 | #164 | Good 46.8% |
| Immigrants | South America | 59.9 /100 | #165 | Average 46.7% |
| Hungarians | 59.3 /100 | #166 | Average 46.7% |
| Immigrants | Sierra Leone | 59.2 /100 | #167 | Average 46.7% |
| Immigrants | Somalia | 55.5 /100 | #168 | Average 46.5% |