Polish vs Scandinavian Male Poverty
COMPARE
Polish
Scandinavian
Male Poverty
Male Poverty Comparison
Poles
Scandinavians
9.7%
MALE POVERTY
99.5/ 100
METRIC RATING
30th/ 347
METRIC RANK
10.1%
MALE POVERTY
98.0/ 100
METRIC RATING
58th/ 347
METRIC RANK
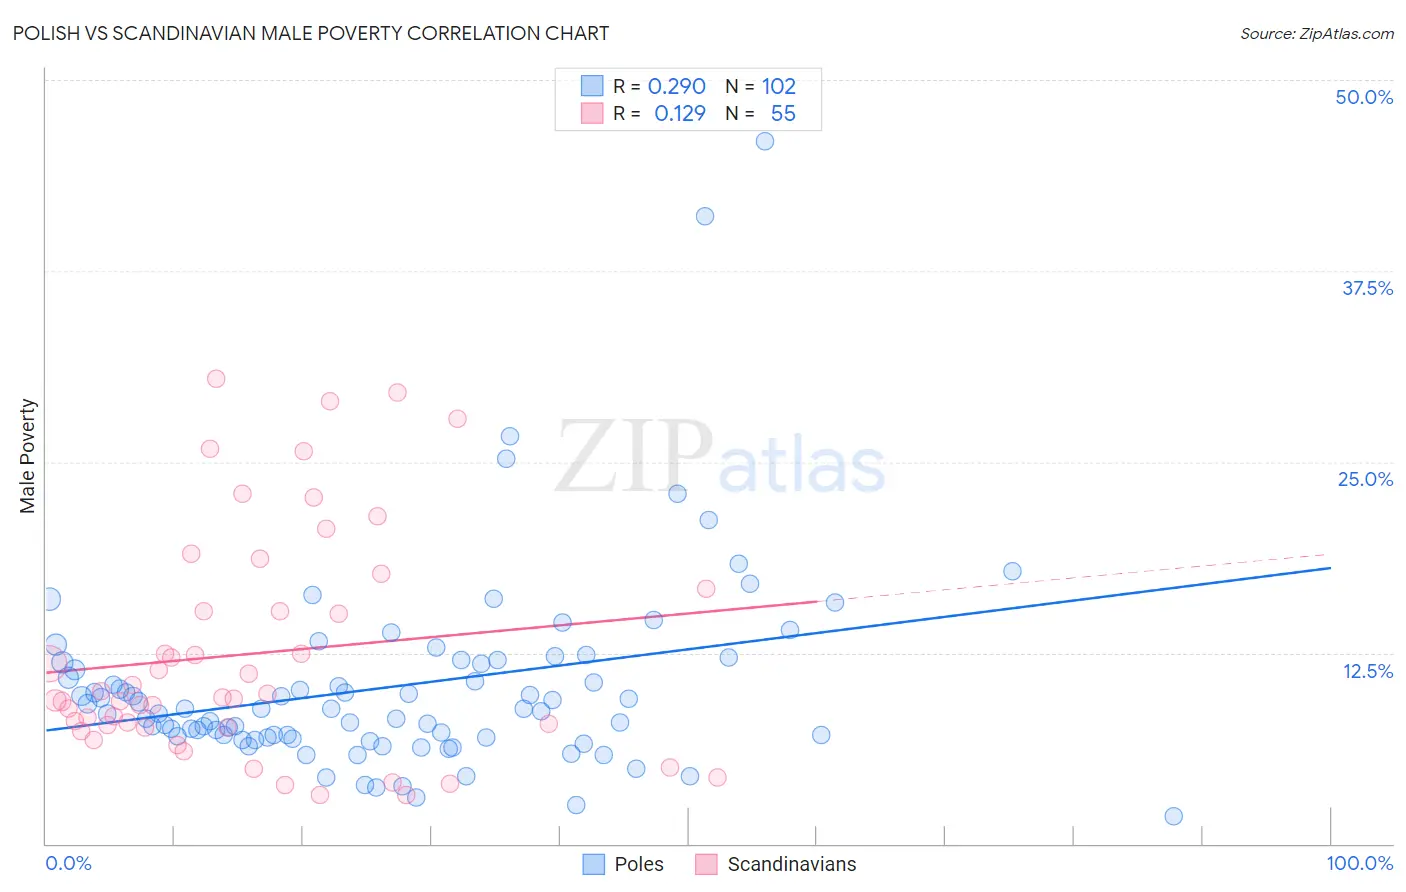
Polish vs Scandinavian Male Poverty Correlation Chart
The statistical analysis conducted on geographies consisting of 558,970,133 people shows a weak positive correlation between the proportion of Poles and poverty level among males in the United States with a correlation coefficient (R) of 0.290 and weighted average of 9.7%. Similarly, the statistical analysis conducted on geographies consisting of 471,949,294 people shows a poor positive correlation between the proportion of Scandinavians and poverty level among males in the United States with a correlation coefficient (R) of 0.129 and weighted average of 10.1%, a difference of 4.2%.
Male Poverty Correlation Summary
| Measurement | Polish | Scandinavian |
| Minimum | 1.8% | 3.2% |
| Maximum | 46.0% | 30.5% |
| Range | 44.2% | 27.3% |
| Mean | 10.3% | 12.4% |
| Median | 8.8% | 9.6% |
| Interquartile 25% (IQ1) | 7.0% | 7.6% |
| Interquartile 75% (IQ3) | 11.9% | 16.7% |
| Interquartile Range (IQR) | 4.9% | 9.0% |
| Standard Deviation (Sample) | 6.5% | 7.4% |
| Standard Deviation (Population) | 6.5% | 7.3% |
Similar Demographics by Male Poverty
Demographics Similar to Poles by Male Poverty
In terms of male poverty, the demographic groups most similar to Poles are Tongan (9.7%, a difference of 0.020%), Greek (9.7%, a difference of 0.080%), Immigrants from Korea (9.7%, a difference of 0.12%), Danish (9.7%, a difference of 0.20%), and Macedonian (9.7%, a difference of 0.23%).
| Demographics | Rating | Rank | Male Poverty |
| Italians | 99.7 /100 | #23 | Exceptional 9.6% |
| Swedes | 99.7 /100 | #24 | Exceptional 9.6% |
| Eastern Europeans | 99.6 /100 | #25 | Exceptional 9.6% |
| Burmese | 99.6 /100 | #26 | Exceptional 9.7% |
| Danes | 99.6 /100 | #27 | Exceptional 9.7% |
| Immigrants | Korea | 99.6 /100 | #28 | Exceptional 9.7% |
| Greeks | 99.6 /100 | #29 | Exceptional 9.7% |
| Poles | 99.5 /100 | #30 | Exceptional 9.7% |
| Tongans | 99.5 /100 | #31 | Exceptional 9.7% |
| Macedonians | 99.5 /100 | #32 | Exceptional 9.7% |
| Immigrants | Northern Europe | 99.5 /100 | #33 | Exceptional 9.7% |
| Immigrants | Poland | 99.5 /100 | #34 | Exceptional 9.8% |
| Iranians | 99.4 /100 | #35 | Exceptional 9.8% |
| Czechs | 99.4 /100 | #36 | Exceptional 9.8% |
| Immigrants | Greece | 99.3 /100 | #37 | Exceptional 9.8% |
Demographics Similar to Scandinavians by Male Poverty
In terms of male poverty, the demographic groups most similar to Scandinavians are Estonian (10.1%, a difference of 0.070%), Immigrants from Europe (10.1%, a difference of 0.13%), Immigrants from Bulgaria (10.1%, a difference of 0.22%), Ukrainian (10.1%, a difference of 0.22%), and Austrian (10.1%, a difference of 0.24%).
| Demographics | Rating | Rank | Male Poverty |
| Immigrants | Croatia | 98.7 /100 | #51 | Exceptional 10.0% |
| Asians | 98.7 /100 | #52 | Exceptional 10.0% |
| Immigrants | Czechoslovakia | 98.6 /100 | #53 | Exceptional 10.0% |
| Immigrants | Austria | 98.5 /100 | #54 | Exceptional 10.0% |
| Germans | 98.3 /100 | #55 | Exceptional 10.1% |
| Immigrants | Bulgaria | 98.2 /100 | #56 | Exceptional 10.1% |
| Estonians | 98.1 /100 | #57 | Exceptional 10.1% |
| Scandinavians | 98.0 /100 | #58 | Exceptional 10.1% |
| Immigrants | Europe | 97.9 /100 | #59 | Exceptional 10.1% |
| Ukrainians | 97.9 /100 | #60 | Exceptional 10.1% |
| Austrians | 97.8 /100 | #61 | Exceptional 10.1% |
| Immigrants | Italy | 97.8 /100 | #62 | Exceptional 10.2% |
| Slovaks | 97.7 /100 | #63 | Exceptional 10.2% |
| Swiss | 97.5 /100 | #64 | Exceptional 10.2% |
| Zimbabweans | 97.5 /100 | #65 | Exceptional 10.2% |