Yup'ik vs Scandinavian Associate's Degree
COMPARE
Yup'ik
Scandinavian
Associate's Degree
Associate's Degree Comparison
Yup'ik
Scandinavians
25.0%
ASSOCIATE'S DEGREE
0.0/ 100
METRIC RATING
347th/ 347
METRIC RANK
46.9%
ASSOCIATE'S DEGREE
65.2/ 100
METRIC RATING
161st/ 347
METRIC RANK
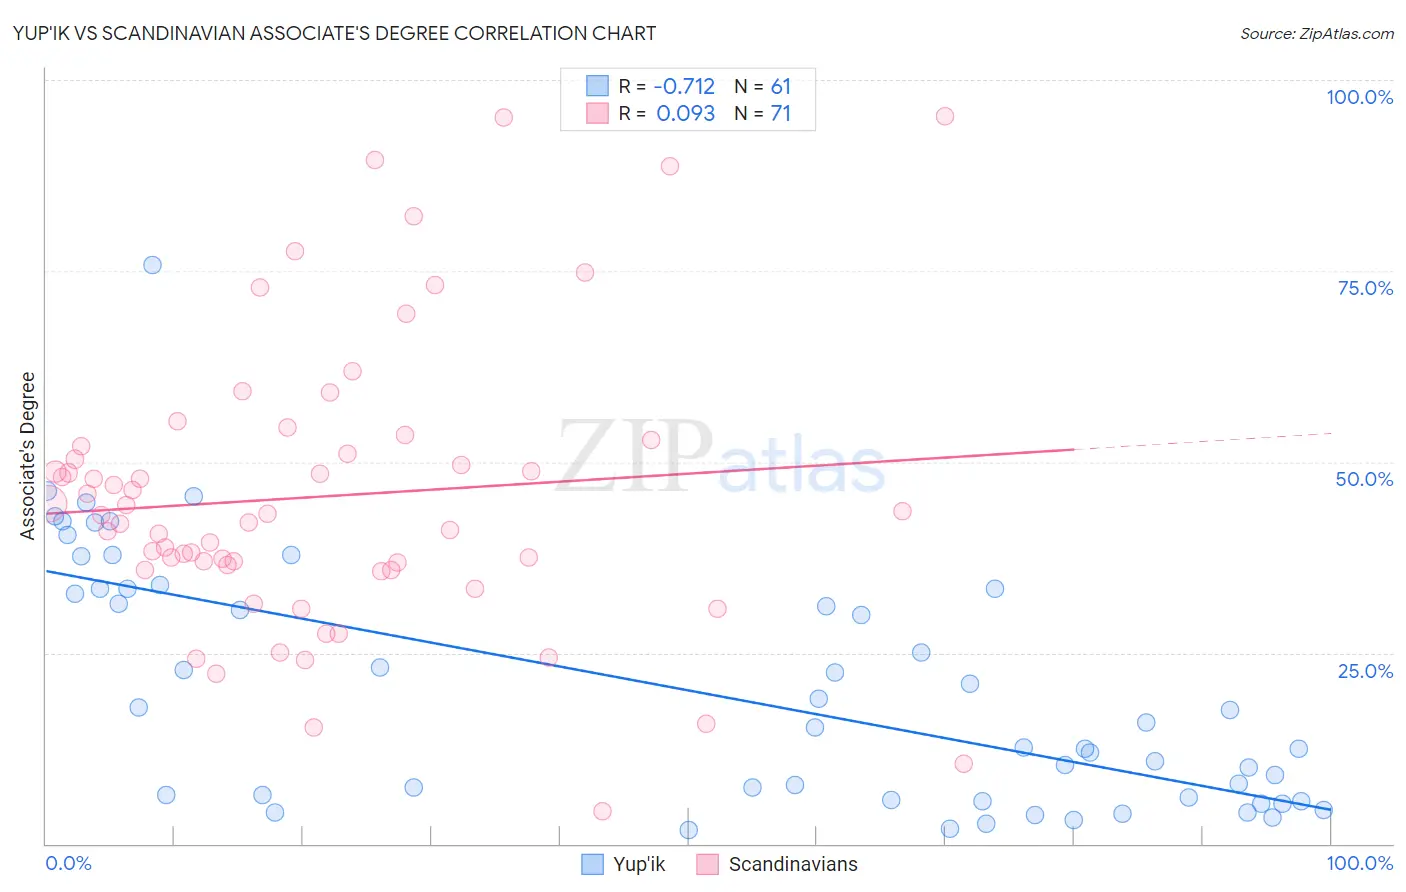
Yup'ik vs Scandinavian Associate's Degree Correlation Chart
The statistical analysis conducted on geographies consisting of 39,962,242 people shows a strong negative correlation between the proportion of Yup'ik and percentage of population with at least associate's degree education in the United States with a correlation coefficient (R) of -0.712 and weighted average of 25.0%. Similarly, the statistical analysis conducted on geographies consisting of 472,632,829 people shows a slight positive correlation between the proportion of Scandinavians and percentage of population with at least associate's degree education in the United States with a correlation coefficient (R) of 0.093 and weighted average of 46.9%, a difference of 87.9%.
Associate's Degree Correlation Summary
| Measurement | Yup'ik | Scandinavian |
| Minimum | 1.8% | 4.2% |
| Maximum | 75.8% | 95.2% |
| Range | 74.0% | 91.0% |
| Mean | 20.1% | 45.5% |
| Median | 15.2% | 43.1% |
| Interquartile 25% (IQ1) | 5.9% | 35.9% |
| Interquartile 75% (IQ3) | 33.3% | 52.1% |
| Interquartile Range (IQR) | 27.4% | 16.2% |
| Standard Deviation (Sample) | 16.1% | 18.8% |
| Standard Deviation (Population) | 16.0% | 18.7% |
Similar Demographics by Associate's Degree
Demographics Similar to Yup'ik by Associate's Degree
In terms of associate's degree, the demographic groups most similar to Yup'ik are Houma (28.2%, a difference of 13.0%), Pima (30.2%, a difference of 21.1%), Yuman (31.3%, a difference of 25.2%), Tohono O'odham (31.8%, a difference of 27.3%), and Yakama (32.3%, a difference of 29.5%).
| Demographics | Rating | Rank | Associate's Degree |
| Mexicans | 0.0 /100 | #333 | Tragic 35.0% |
| Natives/Alaskans | 0.0 /100 | #334 | Tragic 34.9% |
| Spanish American Indians | 0.0 /100 | #335 | Tragic 34.9% |
| Hopi | 0.0 /100 | #336 | Tragic 34.6% |
| Lumbee | 0.0 /100 | #337 | Tragic 34.1% |
| Pueblo | 0.0 /100 | #338 | Tragic 34.0% |
| Immigrants | Mexico | 0.0 /100 | #339 | Tragic 33.7% |
| Navajo | 0.0 /100 | #340 | Tragic 32.6% |
| Inupiat | 0.0 /100 | #341 | Tragic 32.6% |
| Yakama | 0.0 /100 | #342 | Tragic 32.3% |
| Tohono O'odham | 0.0 /100 | #343 | Tragic 31.8% |
| Yuman | 0.0 /100 | #344 | Tragic 31.3% |
| Pima | 0.0 /100 | #345 | Tragic 30.2% |
| Houma | 0.0 /100 | #346 | Tragic 28.2% |
| Yup'ik | 0.0 /100 | #347 | Tragic 25.0% |
Demographics Similar to Scandinavians by Associate's Degree
In terms of associate's degree, the demographic groups most similar to Scandinavians are Scottish (46.9%, a difference of 0.020%), Immigrants from Africa (46.8%, a difference of 0.16%), Somali (46.8%, a difference of 0.22%), Colombian (46.8%, a difference of 0.23%), and Immigrants from Poland (47.1%, a difference of 0.33%).
| Demographics | Rating | Rank | Associate's Degree |
| Immigrants | Kenya | 72.1 /100 | #154 | Good 47.2% |
| Kenyans | 70.6 /100 | #155 | Good 47.1% |
| South Americans | 70.5 /100 | #156 | Good 47.1% |
| Sudanese | 70.3 /100 | #157 | Good 47.1% |
| Immigrants | Germany | 69.7 /100 | #158 | Good 47.1% |
| Immigrants | Poland | 69.2 /100 | #159 | Good 47.1% |
| Scottish | 65.4 /100 | #160 | Good 46.9% |
| Scandinavians | 65.2 /100 | #161 | Good 46.9% |
| Immigrants | Africa | 63.2 /100 | #162 | Good 46.8% |
| Somalis | 62.5 /100 | #163 | Good 46.8% |
| Colombians | 62.4 /100 | #164 | Good 46.8% |
| Immigrants | South America | 59.9 /100 | #165 | Average 46.7% |
| Hungarians | 59.3 /100 | #166 | Average 46.7% |
| Immigrants | Sierra Leone | 59.2 /100 | #167 | Average 46.7% |
| Immigrants | Somalia | 55.5 /100 | #168 | Average 46.5% |